Transport for London: Traffic Accident Interactive DataViz
Client: HABITAT III, The United Nations Conference on Housing and Sustainable Urban Development
Year: 2016
Design/Art Direction by: Calum Hale
Web/UI Development by: Lucia Kocincova
︎ Explore the interactive web app here:
https://lucyia.github.io/tfl-accidents/
This interactive visualisation aims to display traffic accident information as kept by Transport for London for the year 2015. The traffic incidents are plotted geographically on the map, colour coded by severity, and there are some interactive summary statistics in the left panel.
Interactive elements highlight on hover, and can be clicked to filter the selection. The supplementary information is broken down by vehicle type, by the age-range of the people involved in the incidents and also by the London borough in which the incident occurred.
This project was created as part of a submission for the 'Habitat III' conference's "call for submissions" as part of 'cityvis.io' Lucia and I also got the chance to talk about our project at the second 'DataViz London' Meetup on 05 October 2016.
 Home page with a left filter panel and a right panel introducing the site
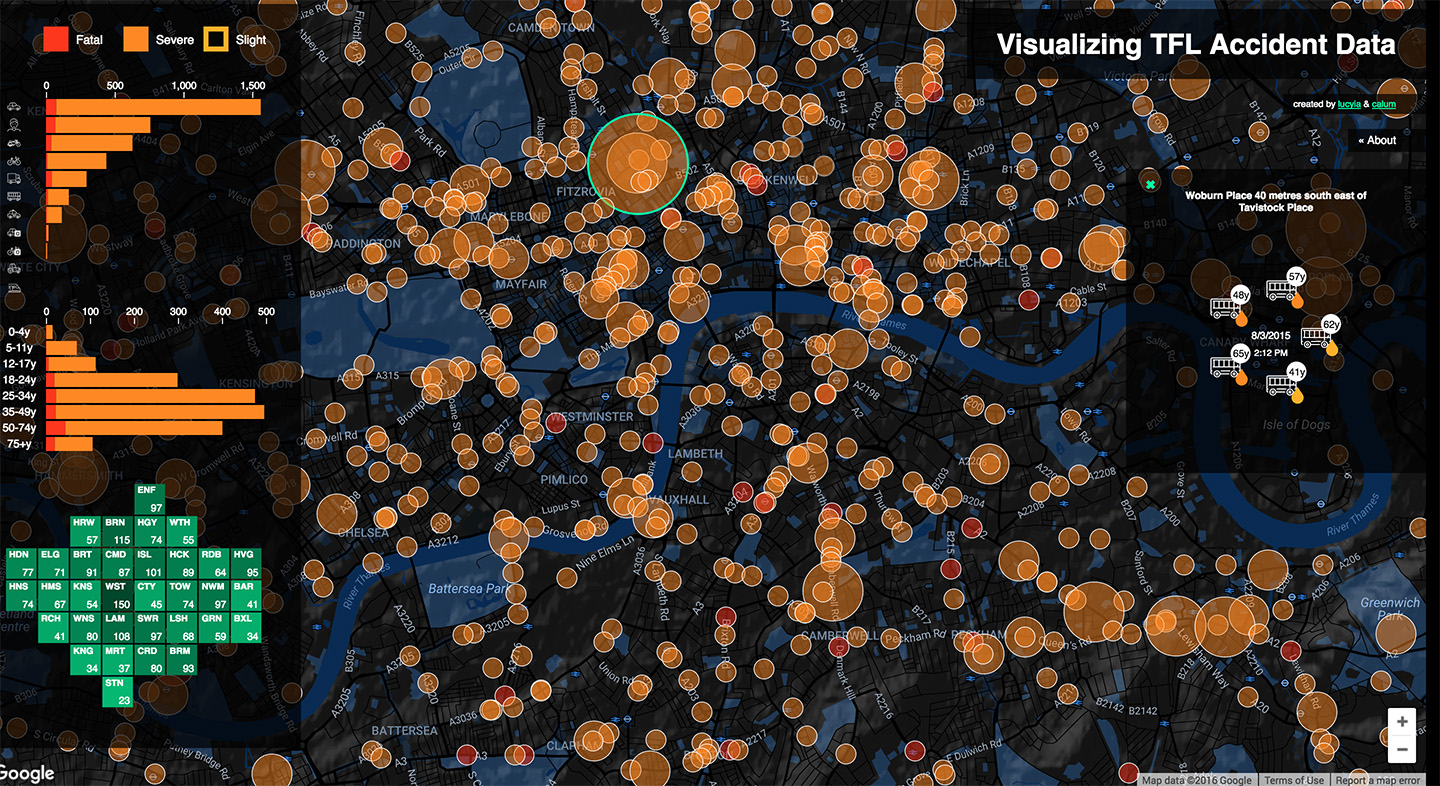 Selecting a node shows the details of the incident
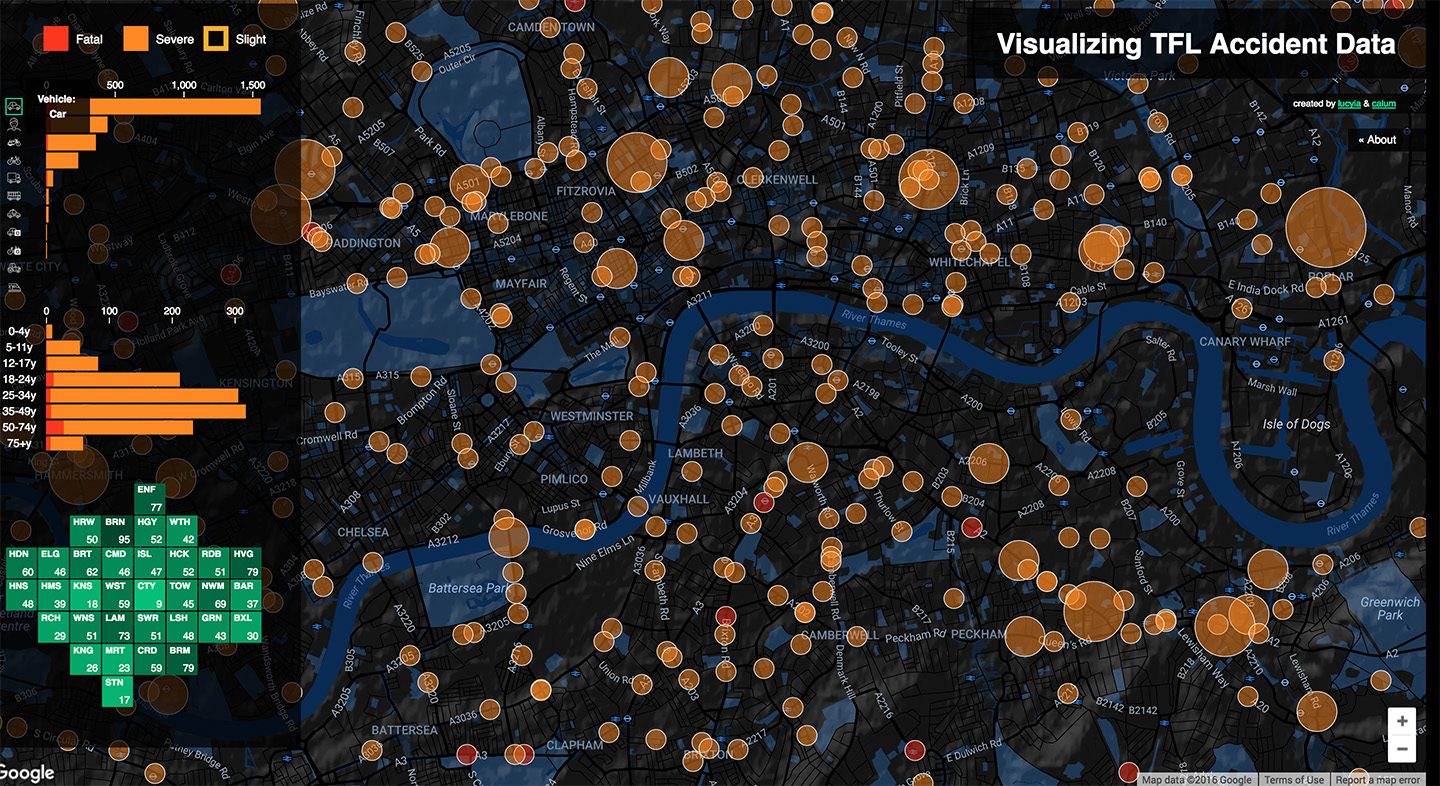 The user can filter by vehicle, in this case showing on incidents involving cars
 Filtering by age-range
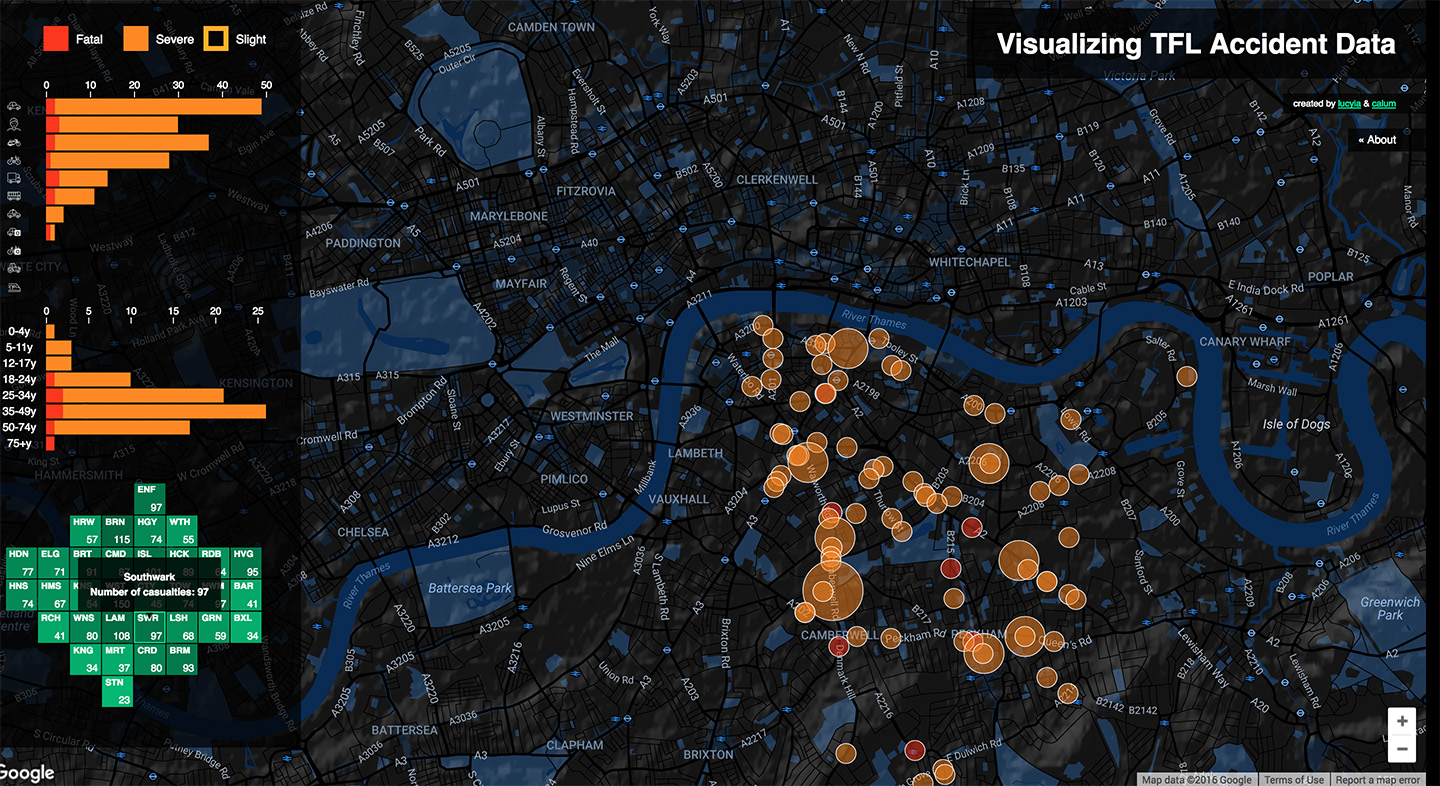 Filtering by London borough
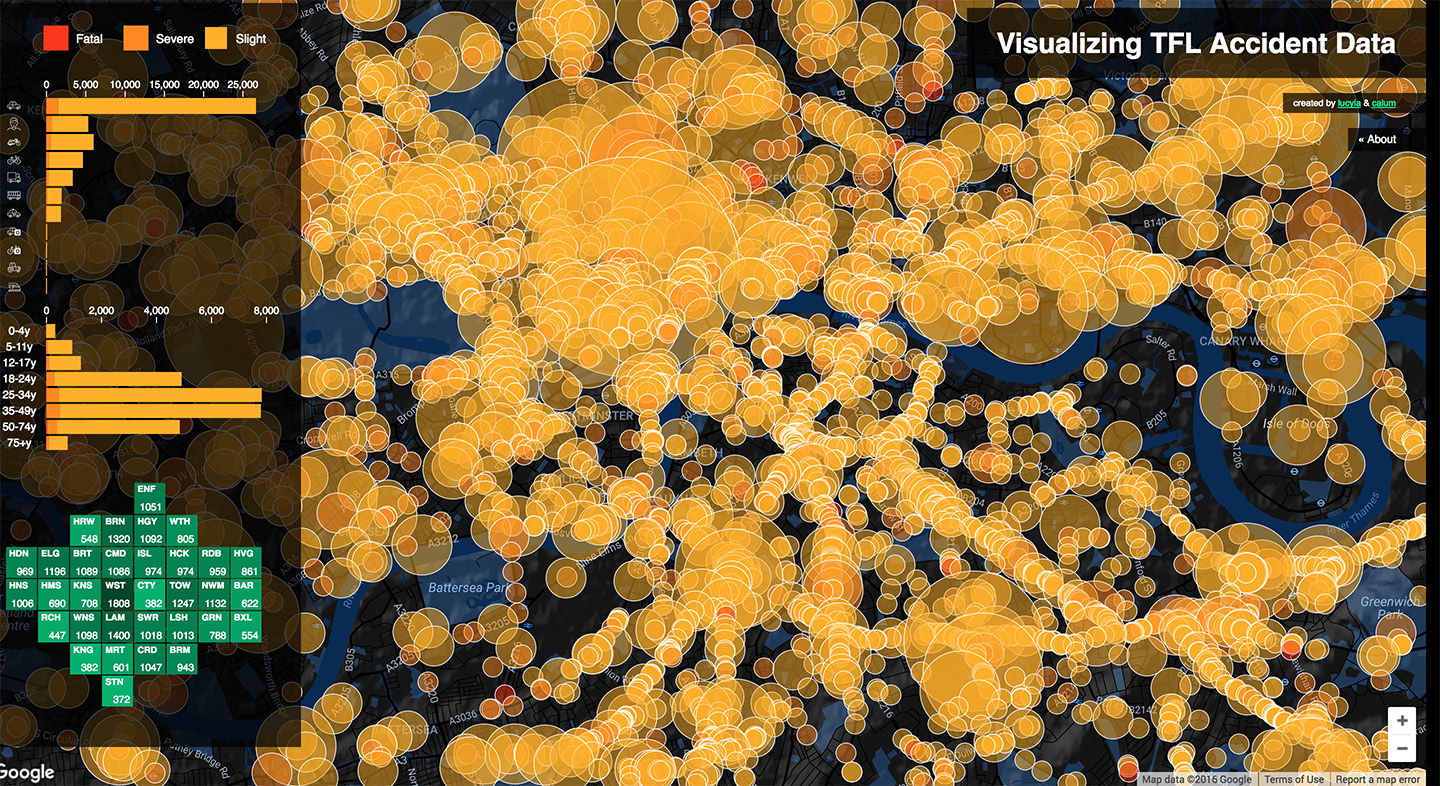 Showing all incident severity types (’slight’ injuries aren’t displayed by default)
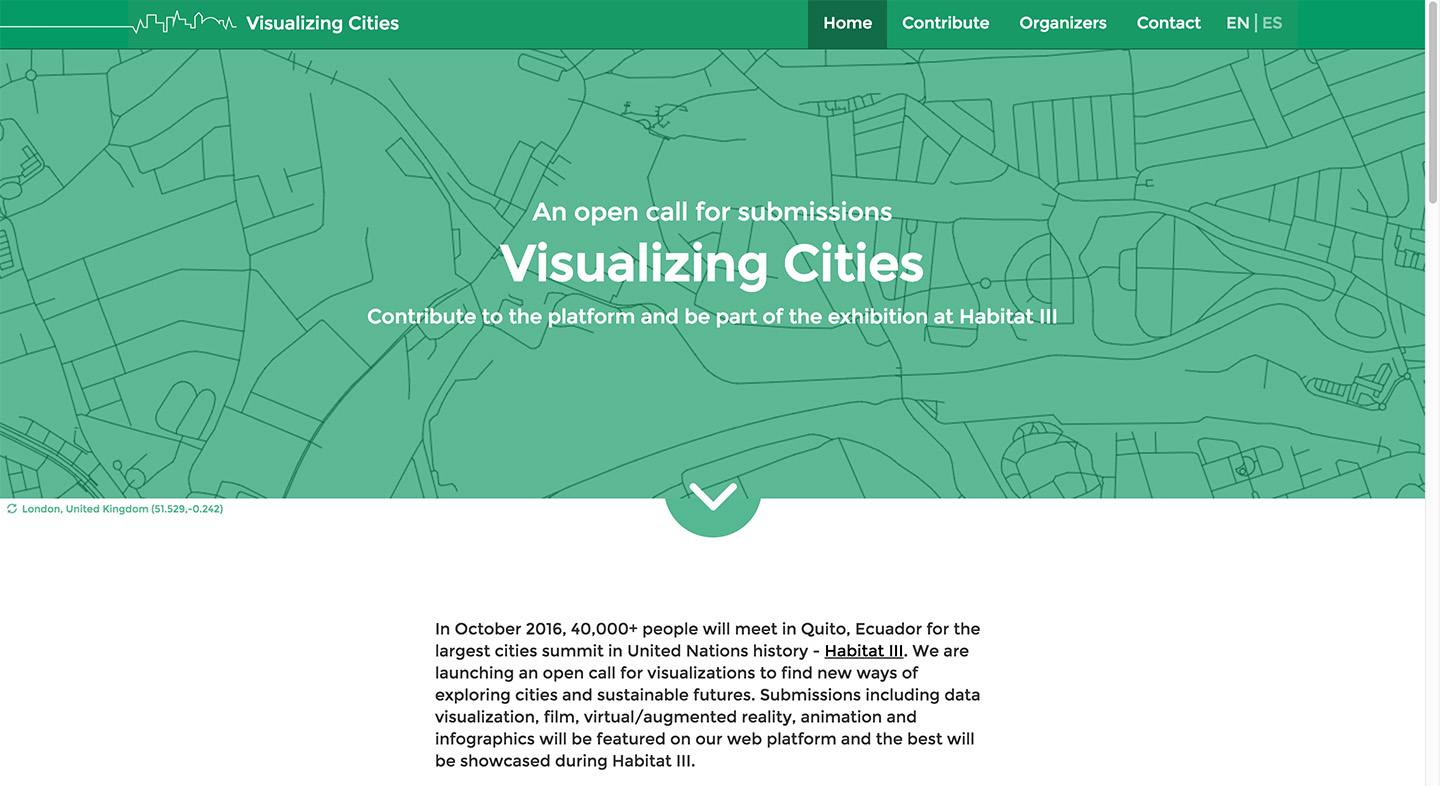 The home page of the Habitat III ‘Visualizing Cities’ call for submission page
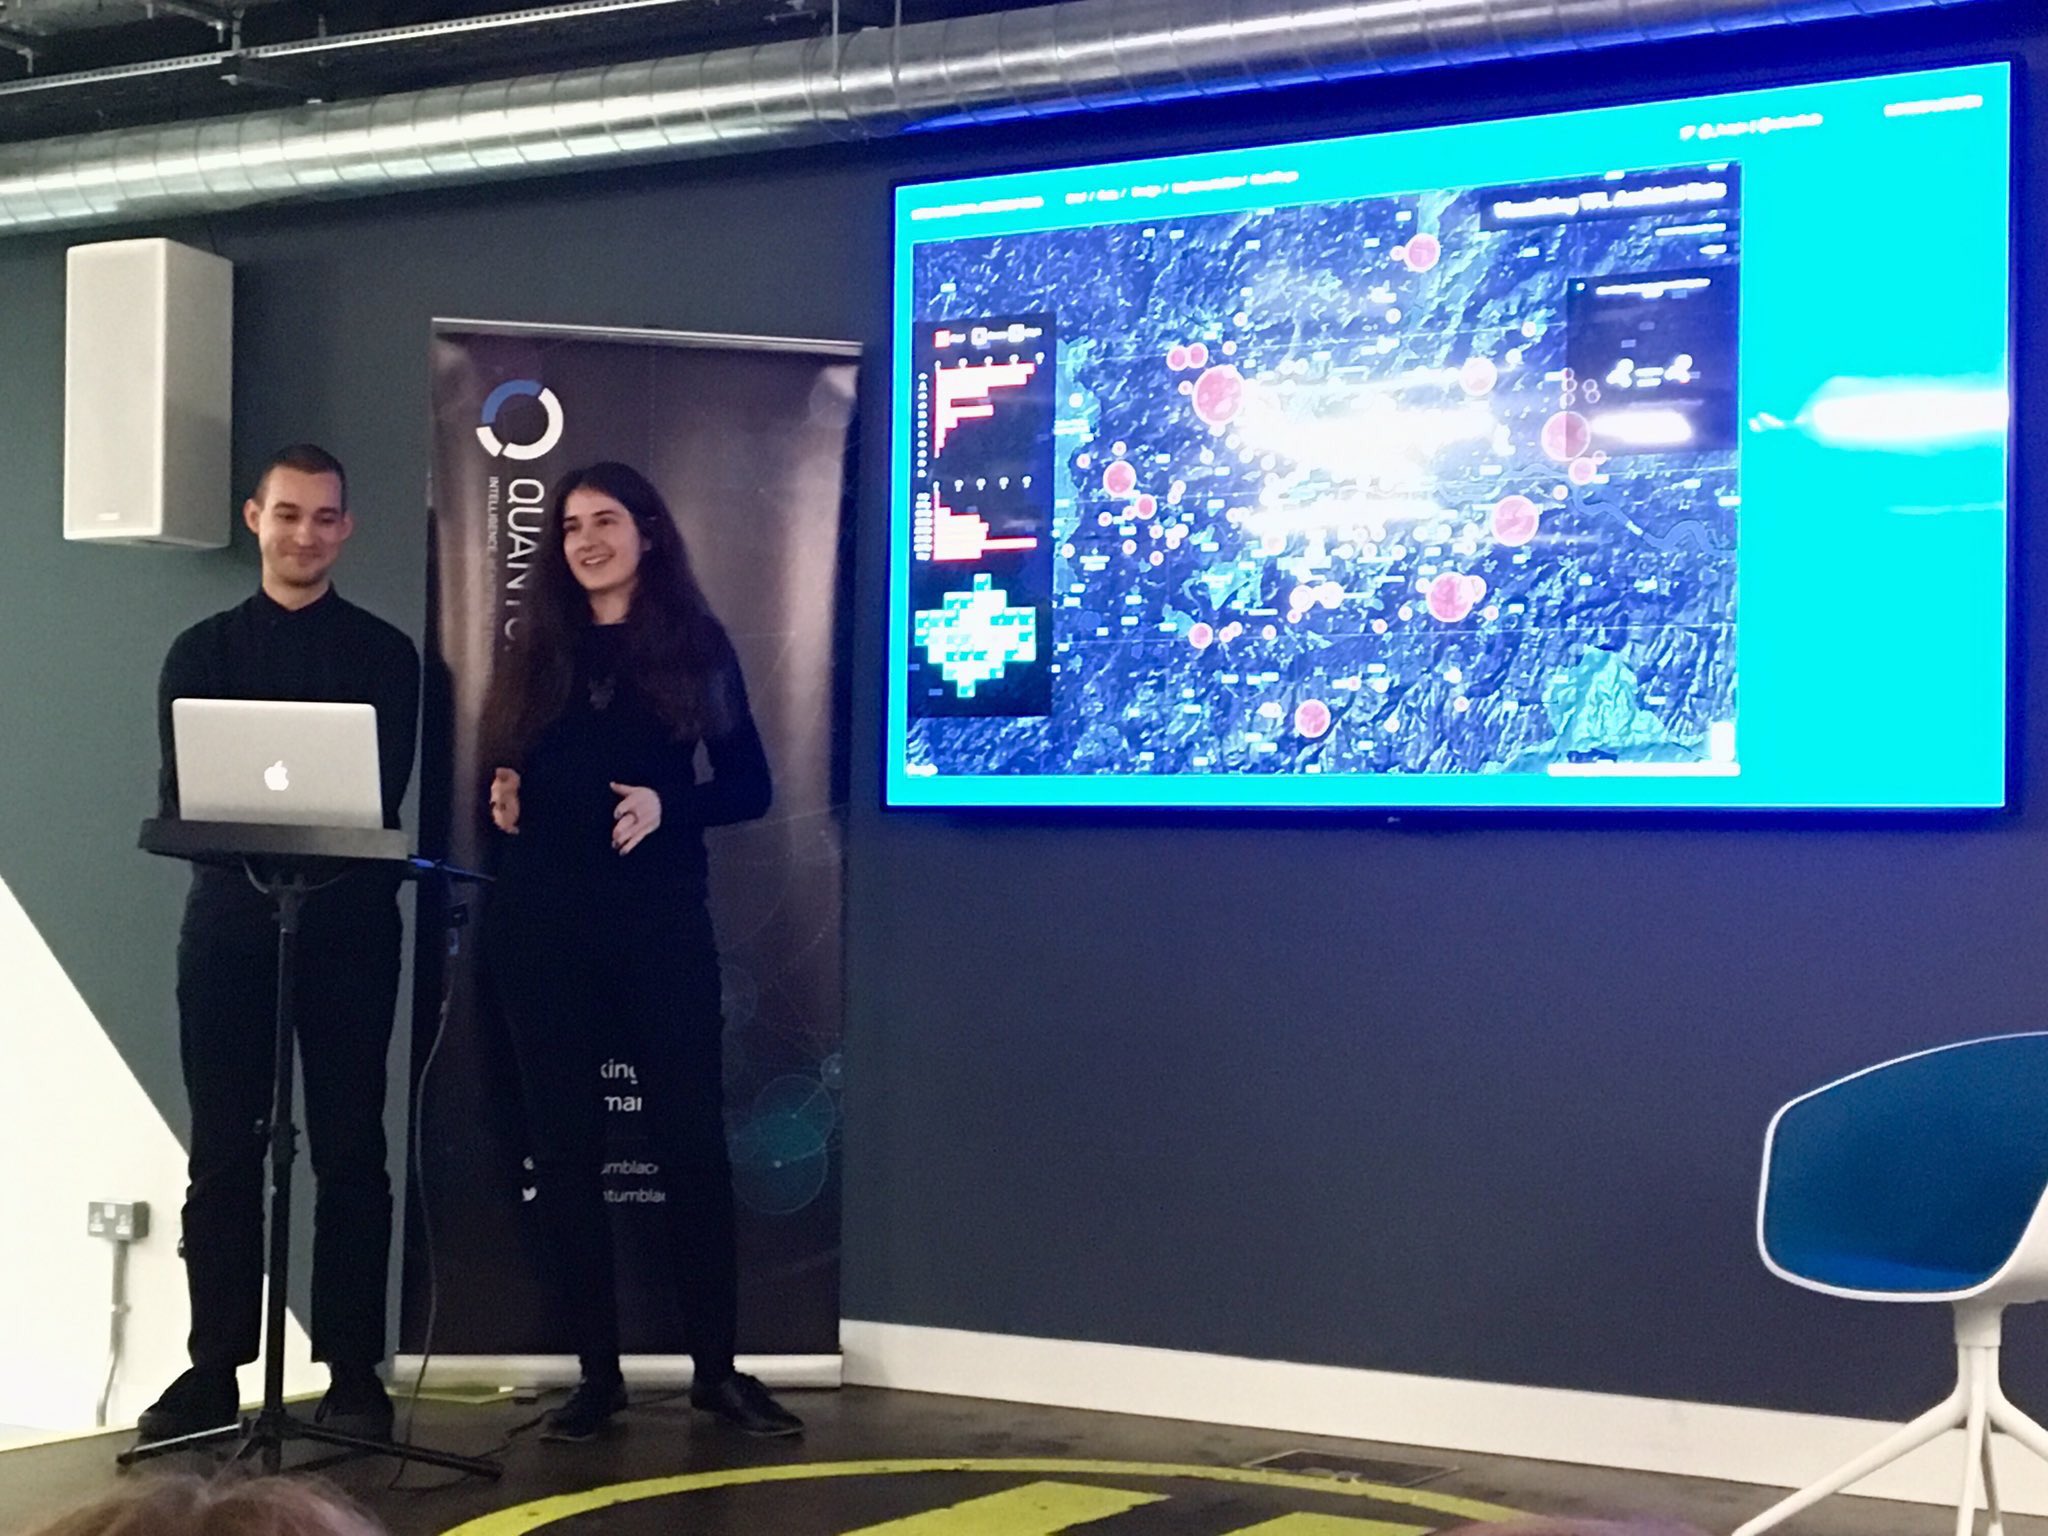 Luciya and I presenting our work at DataVis London Meetup