Multiple Sclerosis: Drug Performance iPad App
Designed at QuantumBlack
Year: 2015
Lead Designer: Calum Hale
Creative Direction: Yves Boussemart
Design © QuantumBlack Visual Analytics Ltd.
All data anonymised
Brief
A large pharmaceutical company were attending a medical conference in Europe and wanted to demonstrate their Research & Development capabilities. We were tasked with creating an app to showcase the effectiveness of their Multiple Sclerosis drugs.
Outcome
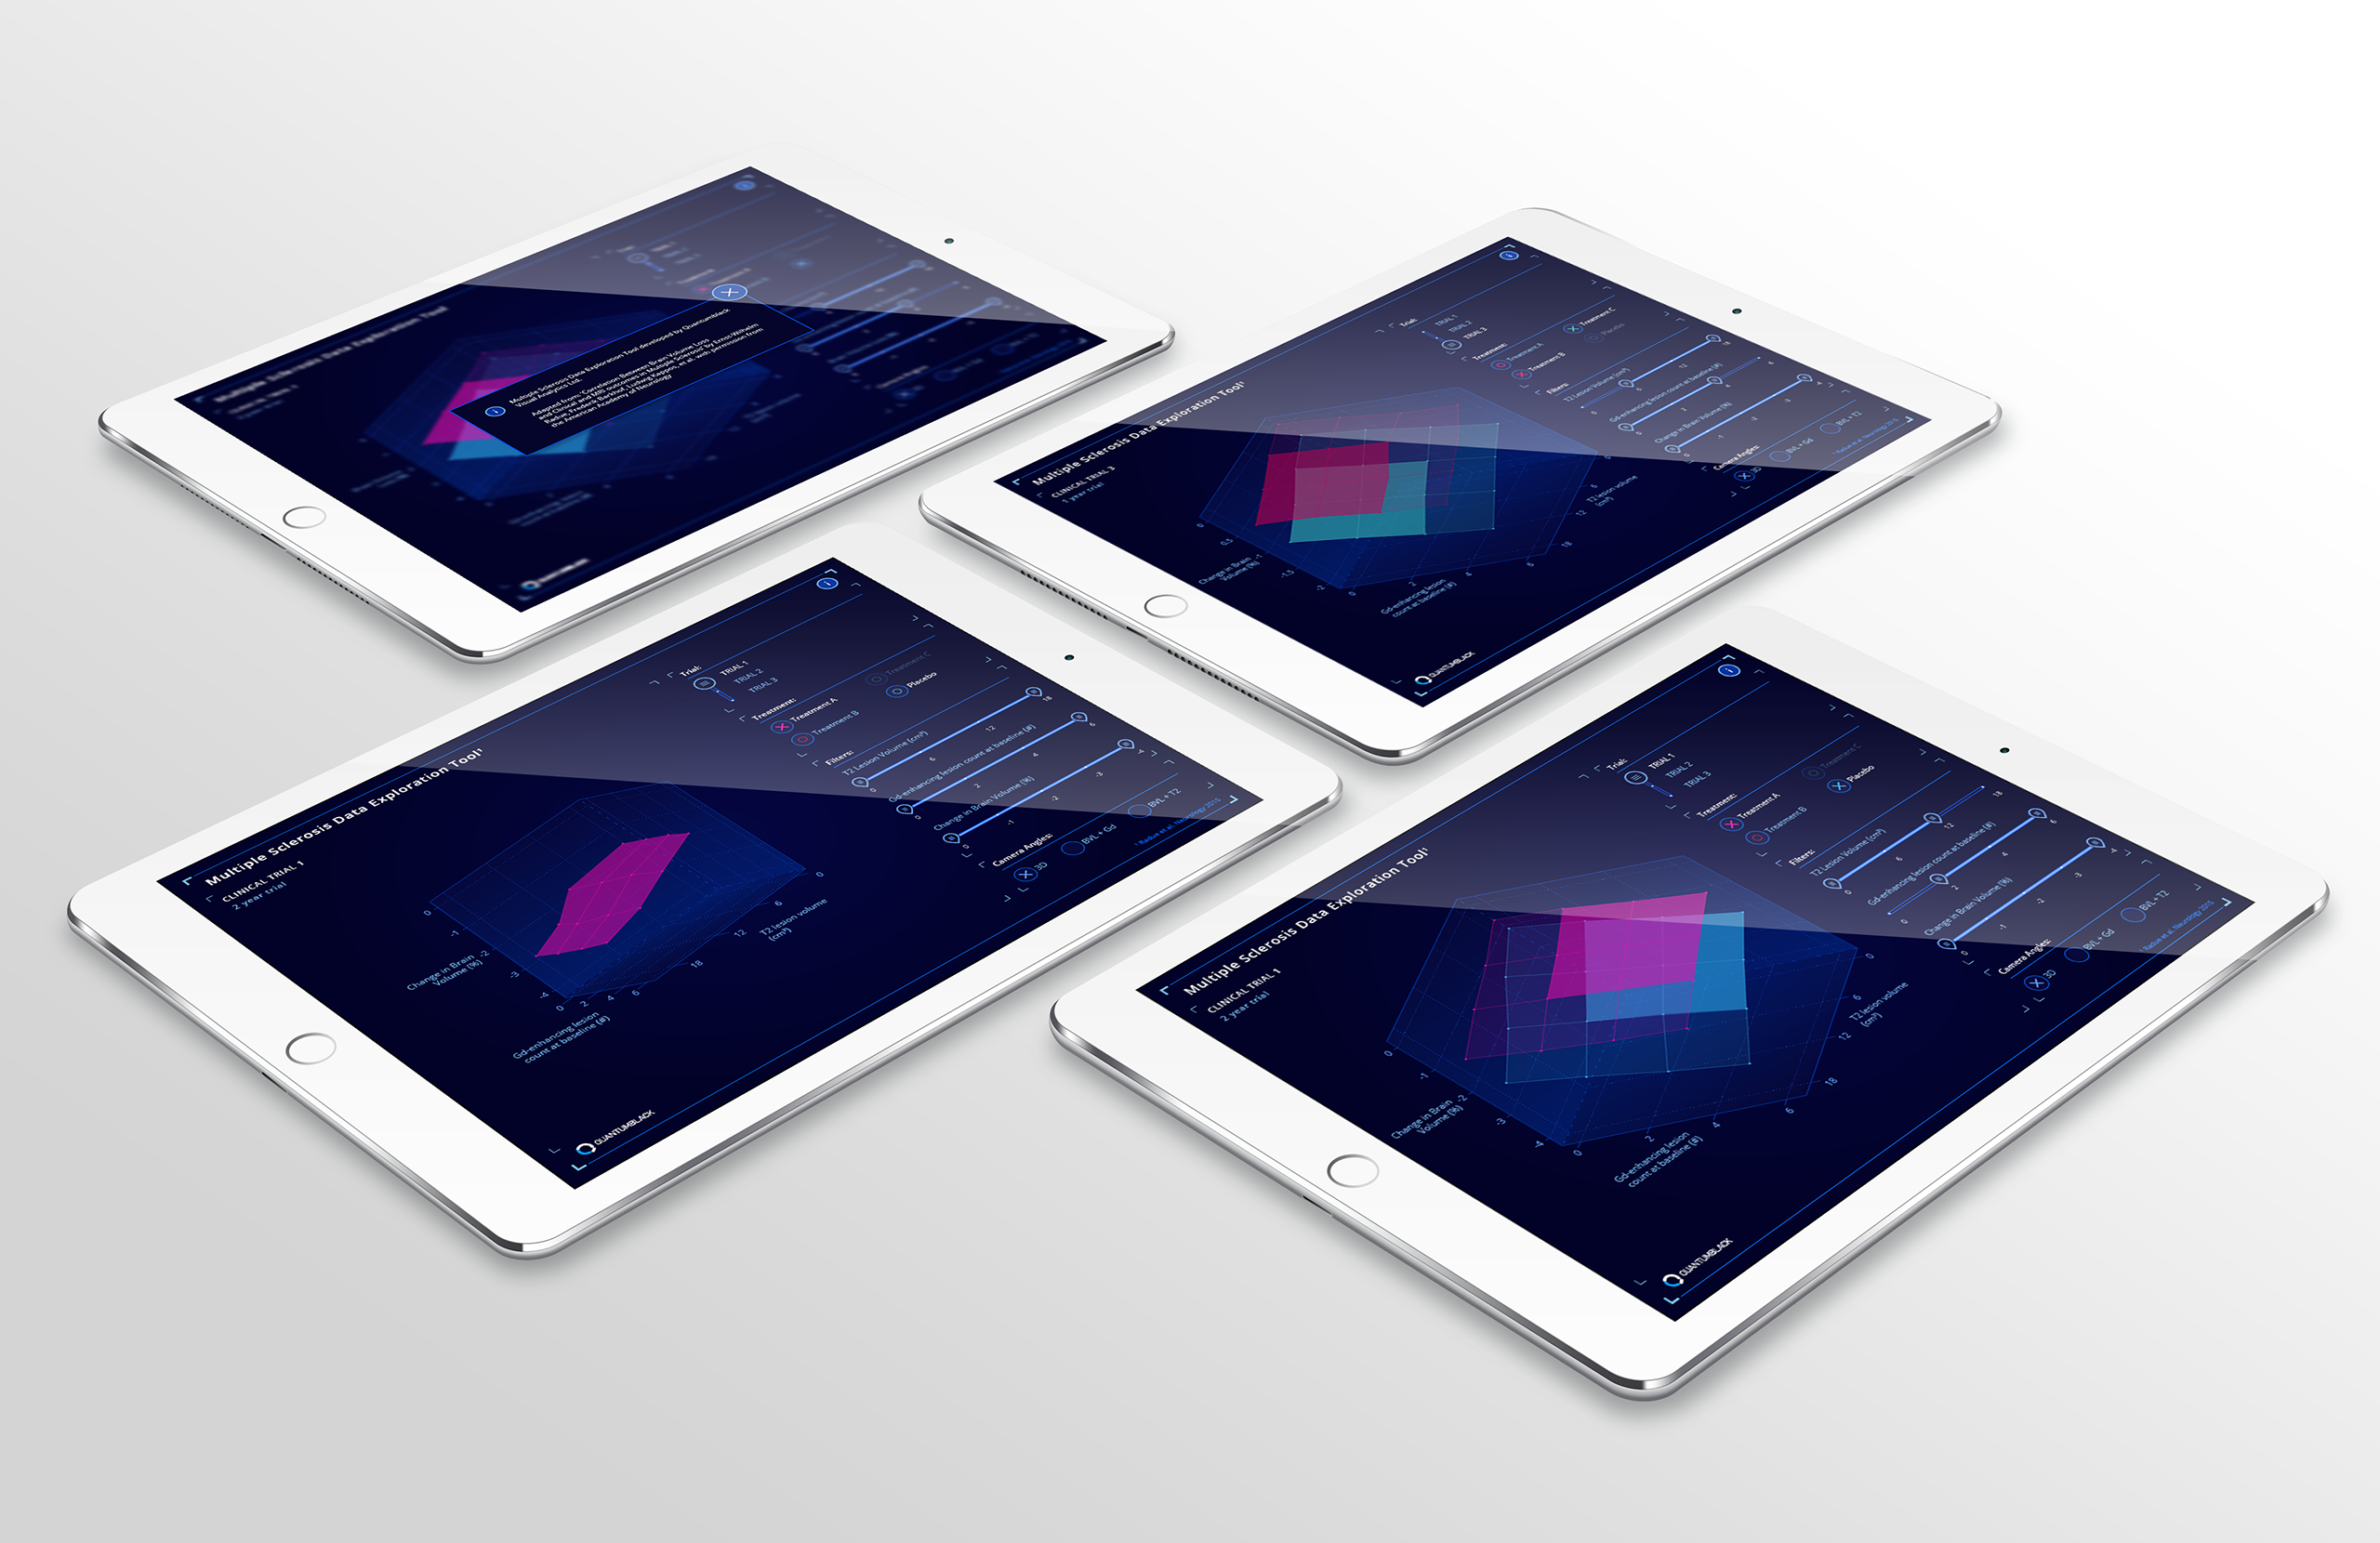
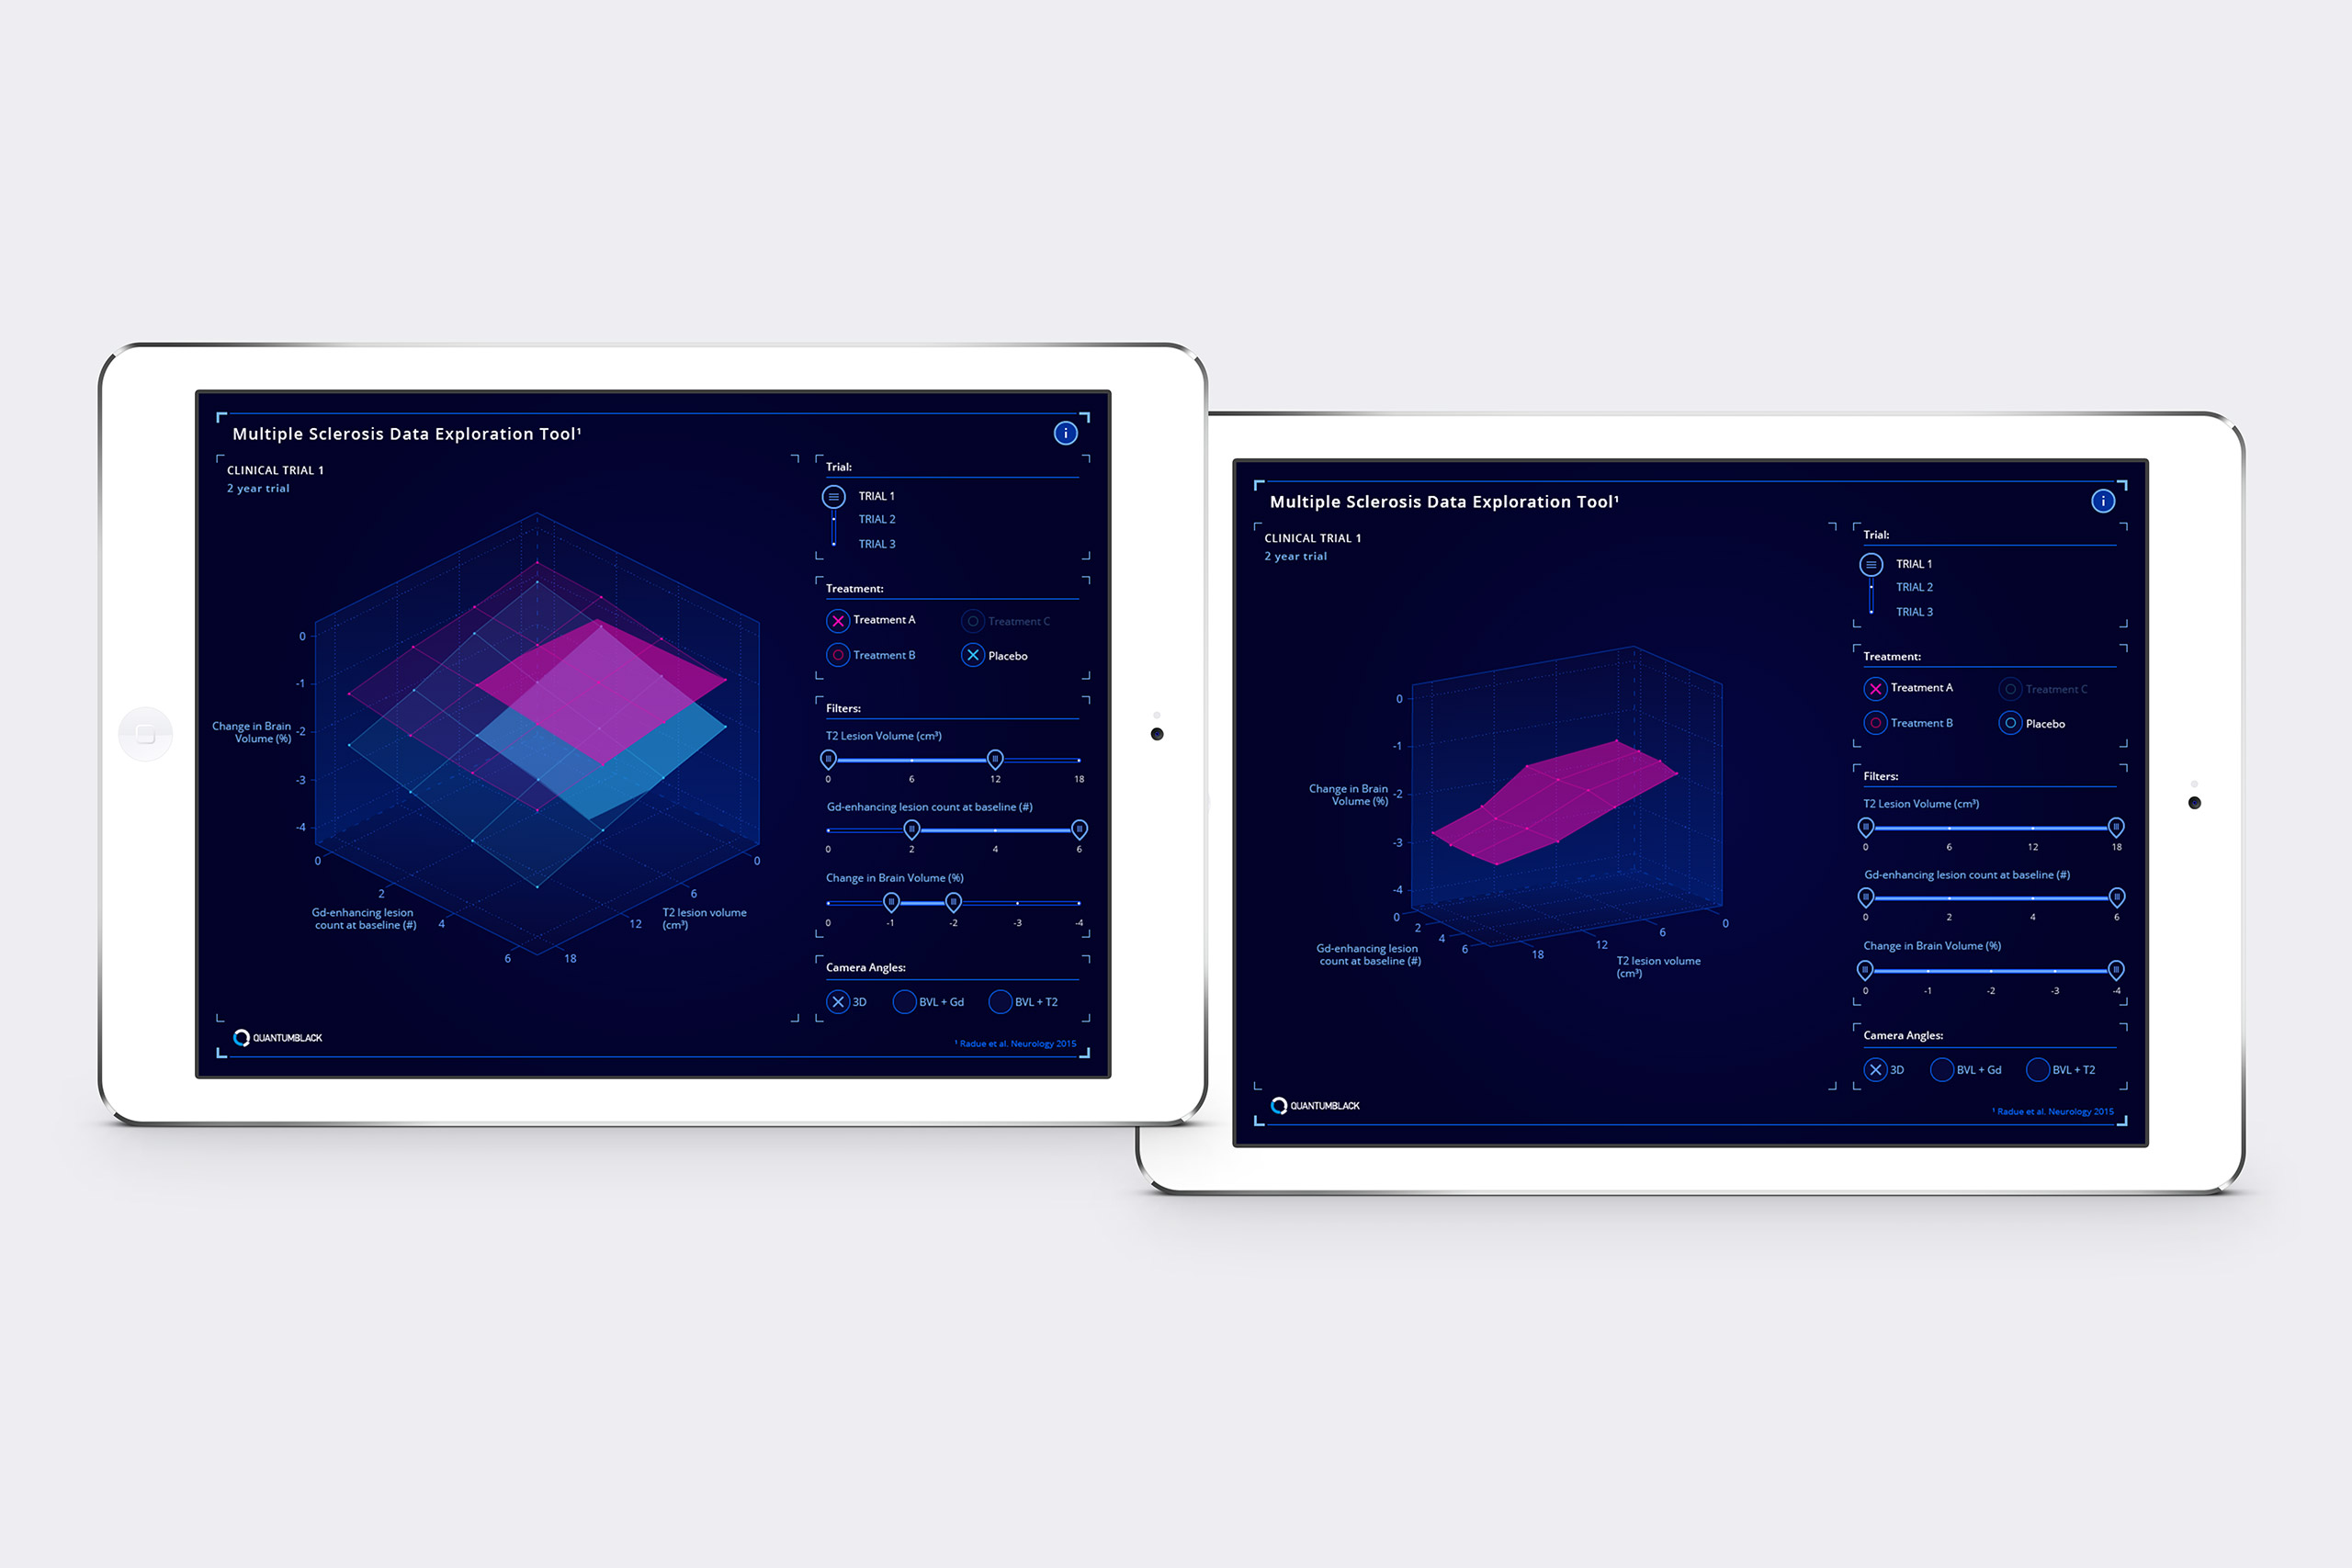
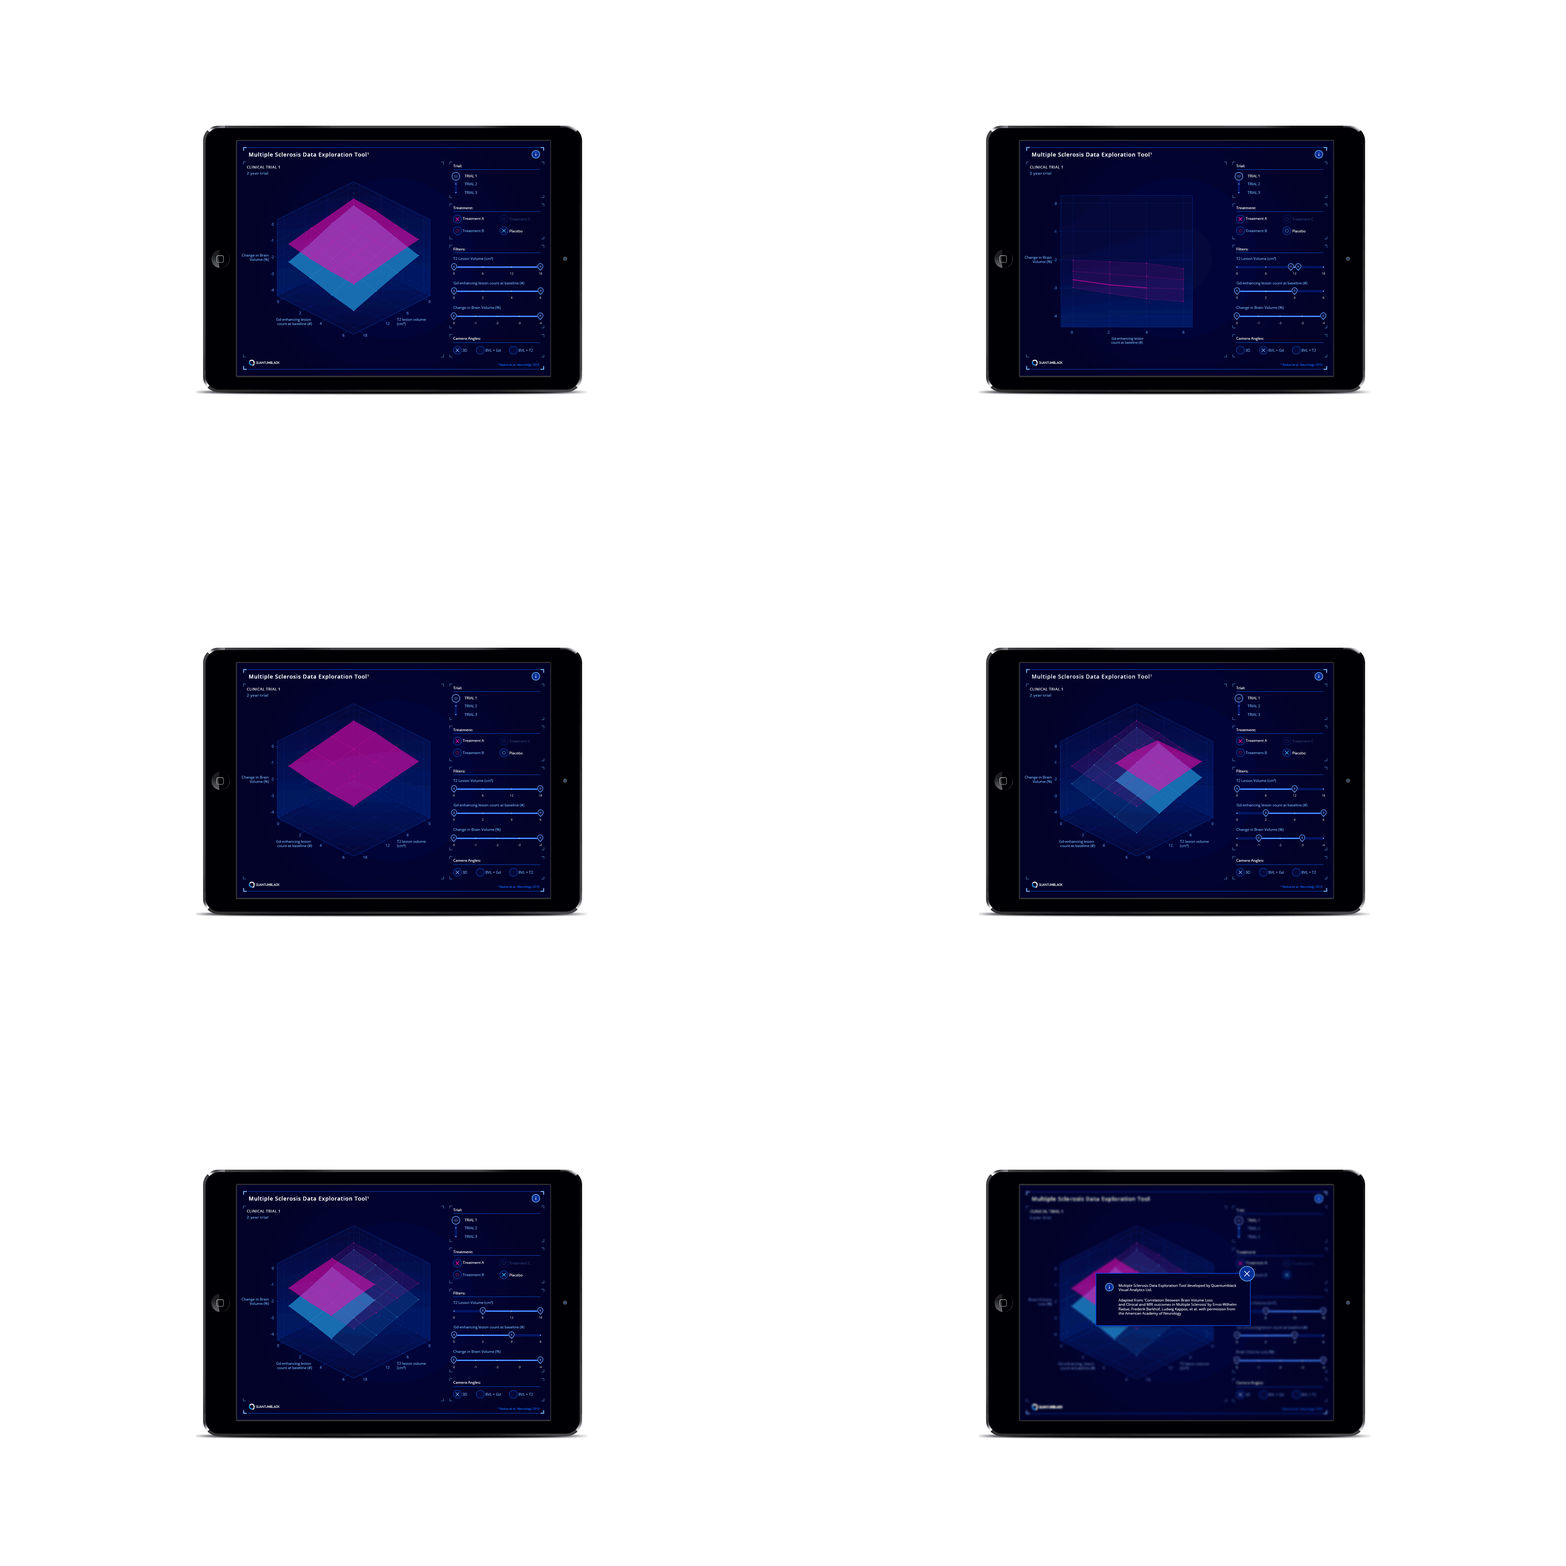
The web app we designed allowed the user to explore data for three clinical trials, measuring three drugs and a control. The data viz solution had three axes so the user could see a ‘surface’ of performance, the highest being the best performing. Via the UI, the user can explore how different sizes and combinations of lesions in the brain lead to a certain percentage of brain volume loss. The graph could also be rotated to only show two metrics.
My Contribution
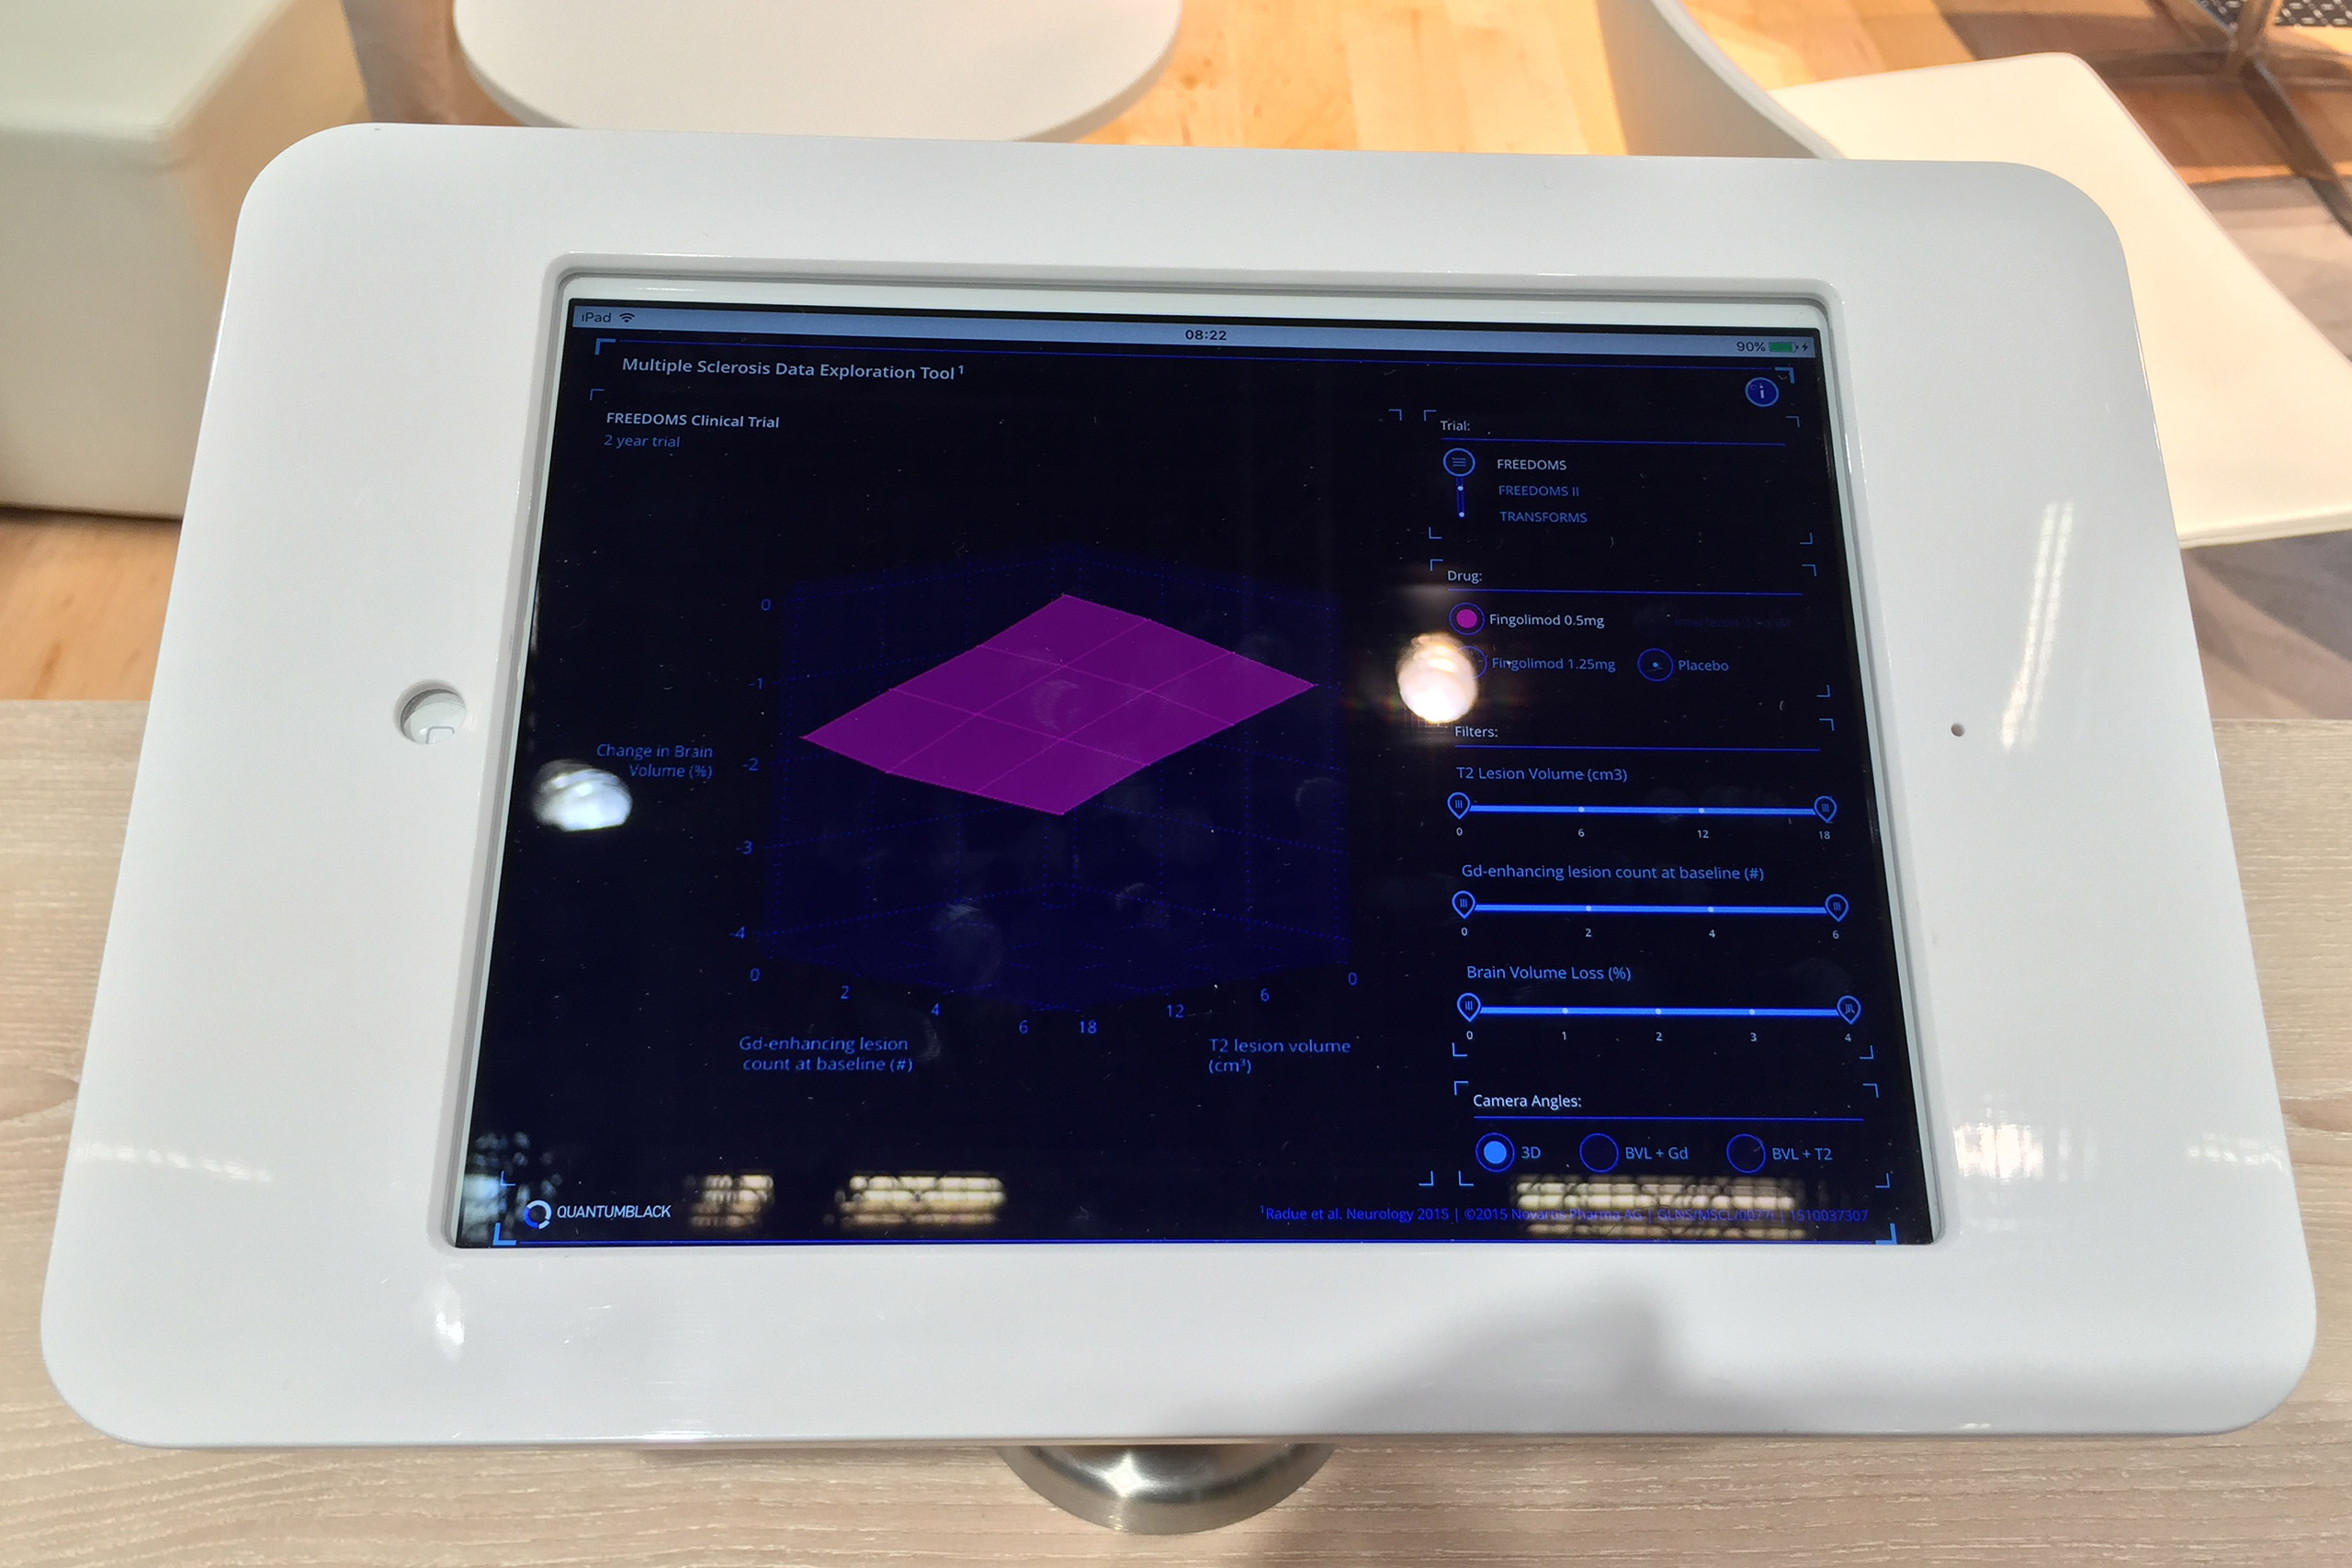
As the lead designer, I came up with visual concepts for representing the data, defined the filter options and also created the look and feel of the user interface. I demonstrated the app in person on the client’s stand at the European medical conference.
 View of the MS app in various interaction states
 View showing selected plane segments
 Views showing comparisons between different drugs’ performance
 View showing how the chart can be rotated to show only two dimensions instead of three
 Animation showing how interacting with the sliders allows the user to selectively compare surface plane sectors
 The app in situ on the client’s stand at the medical conference in Barcelona