Fast Moving Consumer Goods: Brand Portfolio Tool
Designed at QuantumBlack
Year: 2014
UX Designer: Matt Miller
Visual Designer: Calum Hale
Creative Direction: Yves Boussemart
-
All data anonymised
Design © QuantumBlack Visual Analytics Ltd.
Brief
A leading fast-moving consumer goods (FMCG) company need to be able to track its portfolio of products against sales and market share, while also predicting what would happen in the future if they released new products into the market.
Outcome
We designed and built an app that allowed a brand manager to see how their products were performing across world markets. The app included a scenario tool where the user could change metrics such as ‘advertising spend’ and see the predicted impact, driven by data science, on its future sales.
My Contribution
Working under the Creative Director, I documented detailed user journeys to ensure the user didn’t get lost in the portfolio. Then working alongside senior visual designers, I helped create the look and feel for the app. I also oversaw the build of the application working with our development team.
Visual Design
![]() Worldwide overview
Worldwide overview
![]() Viewing the performance of a particular brand category
Viewing the performance of a particular brand category
![]() Viewing the sales value vs. target over time for a particular brand
Viewing the sales value vs. target over time for a particular brand
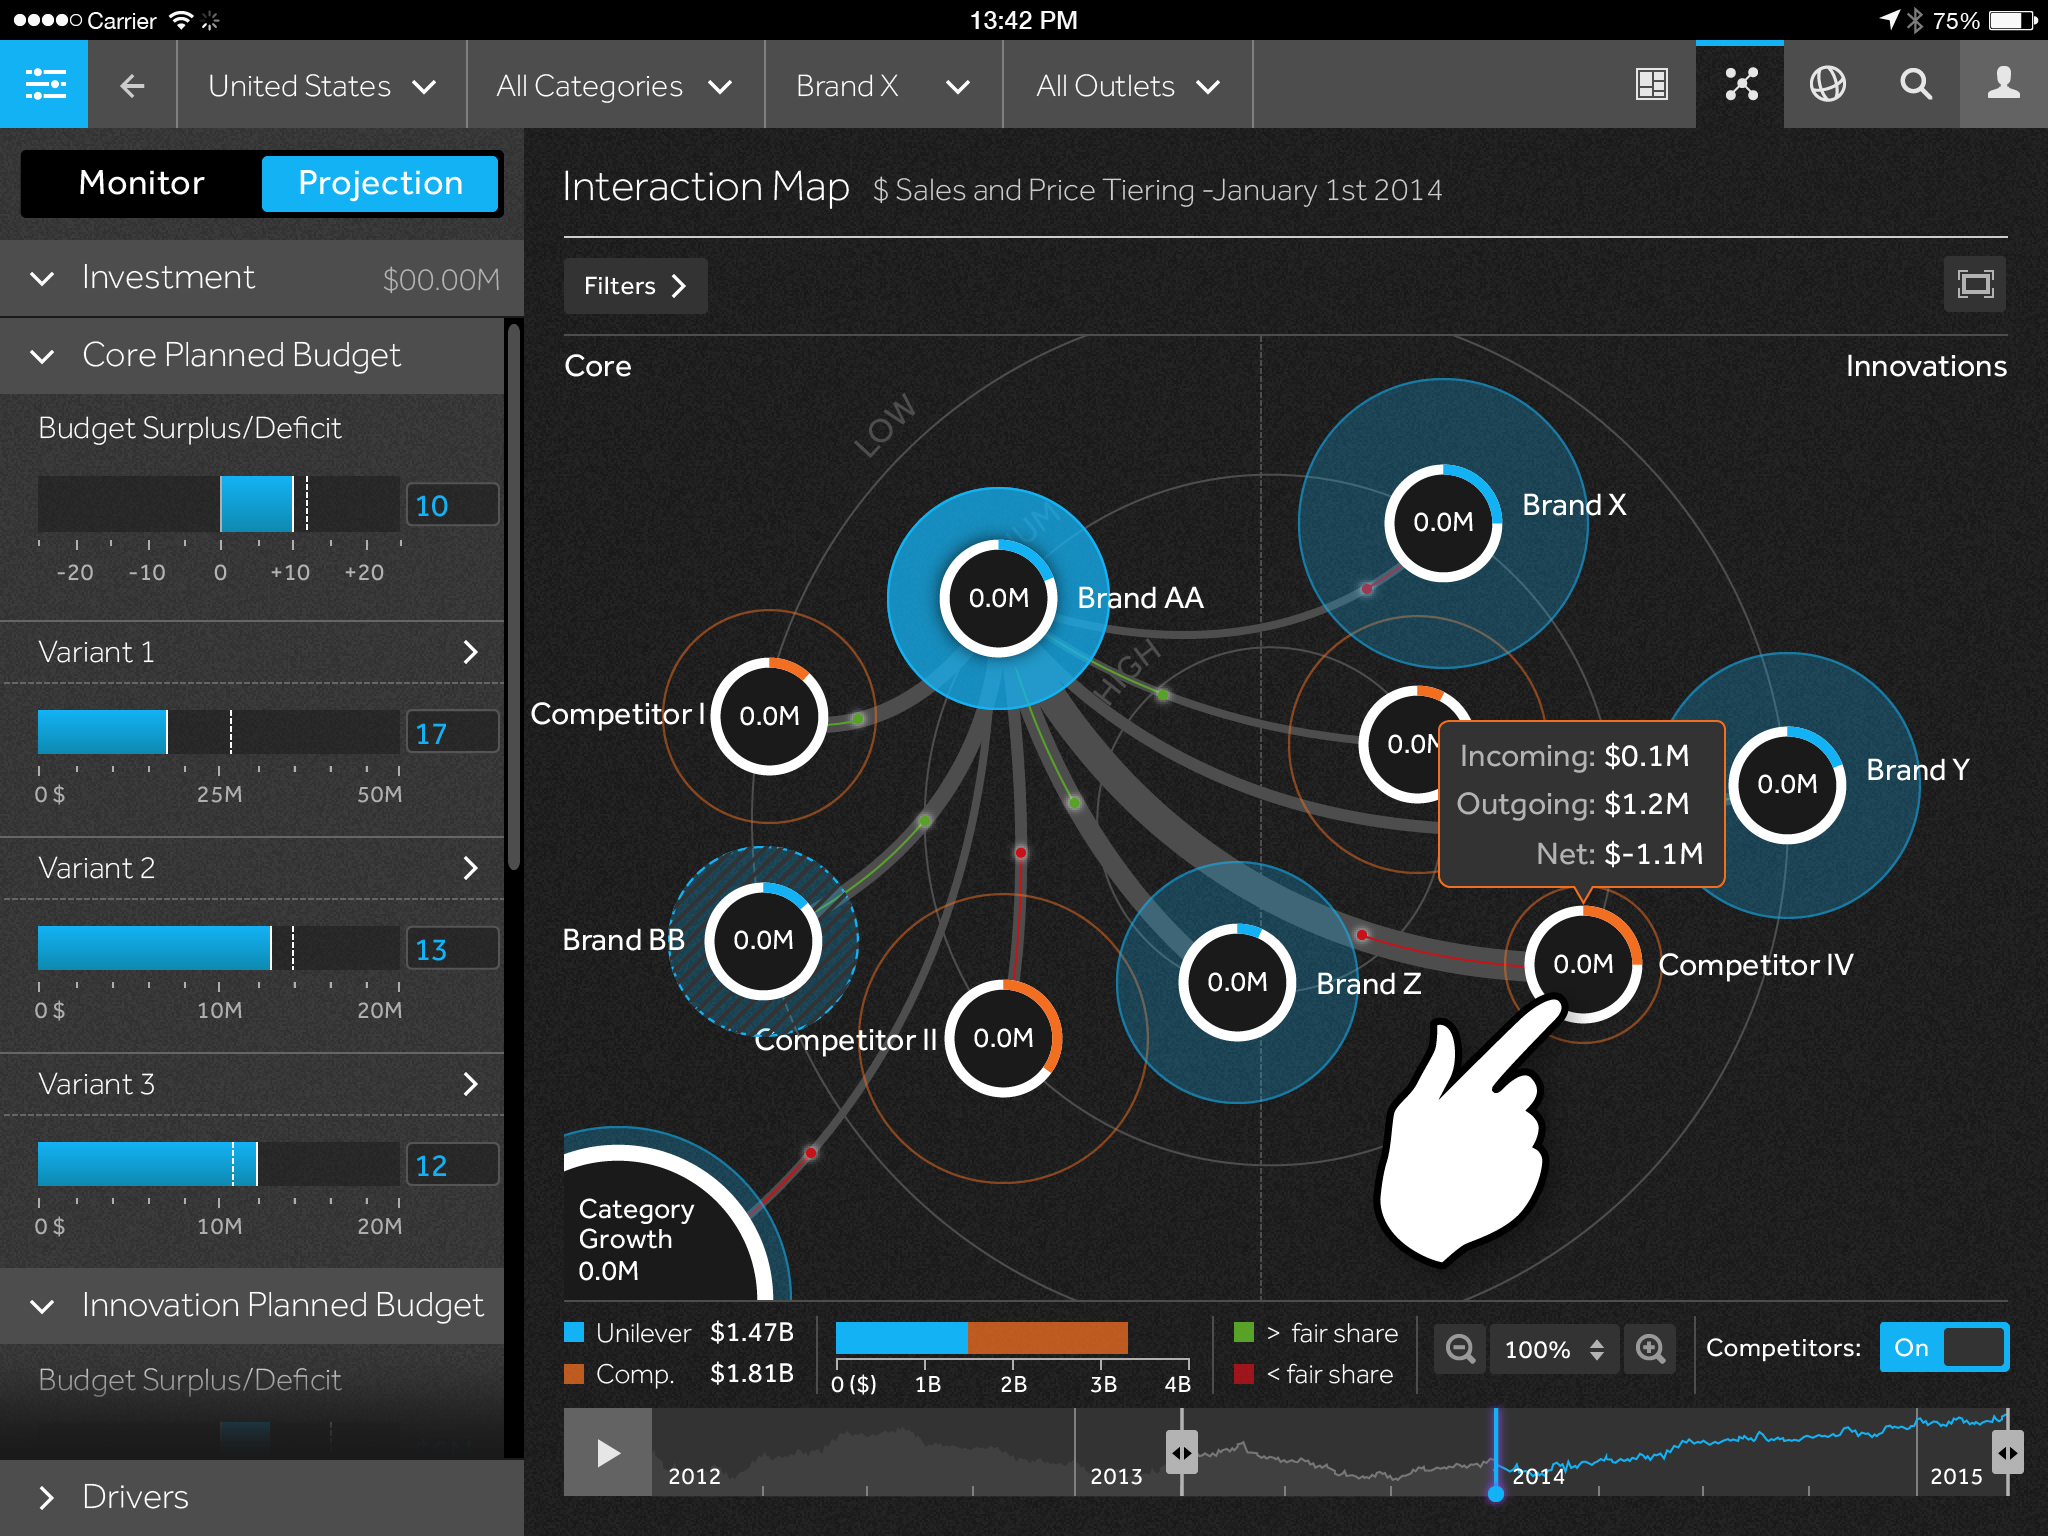
![]() An interaction map showing how sales shift between brands over time, including new brand launches
An interaction map showing how sales shift between brands over time, including new brand launches
![]() Waterfall chart showing the gross margin for a specific brand
Waterfall chart showing the gross margin for a specific brand
![]() Tree map showing market share for a product category
Tree map showing market share for a product category
![]() Charts showing sales value increase/decrease compared to total sales
Charts showing sales value increase/decrease compared to total sales
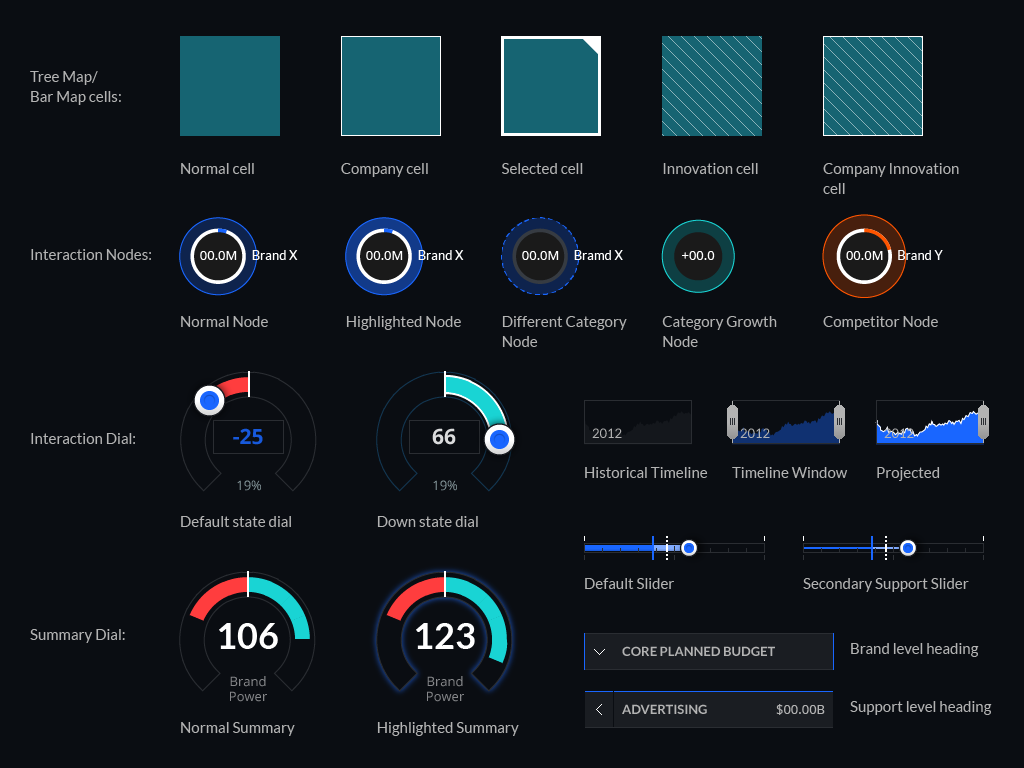
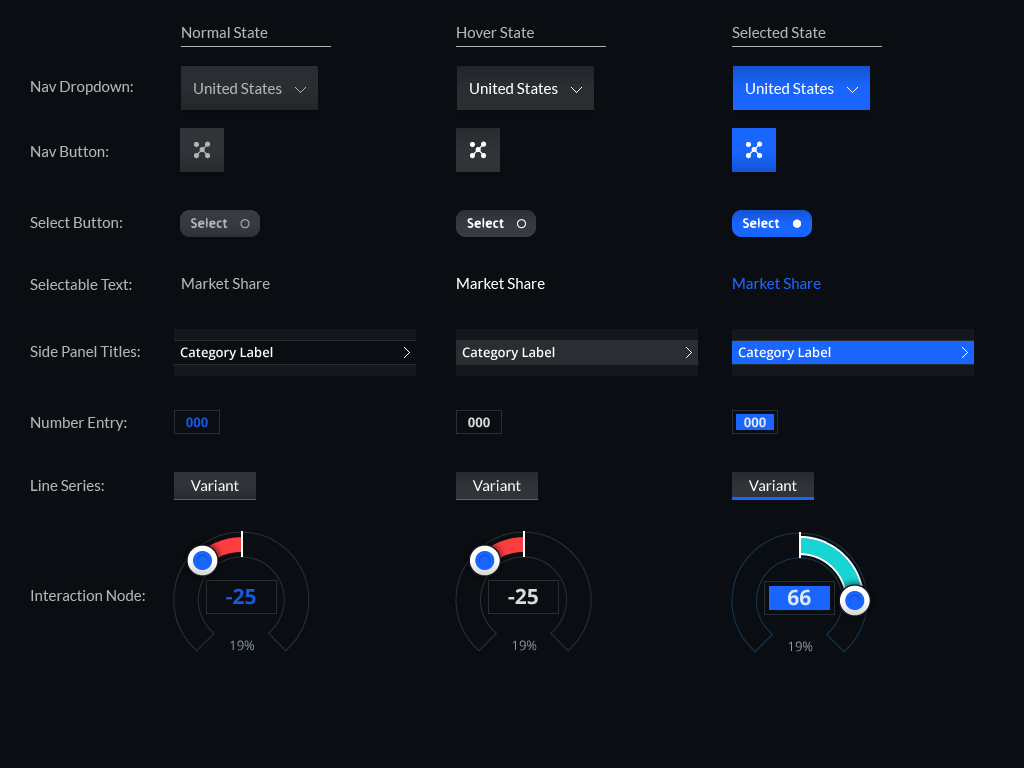
Visual Design Reference for Dev
![]()
![]()
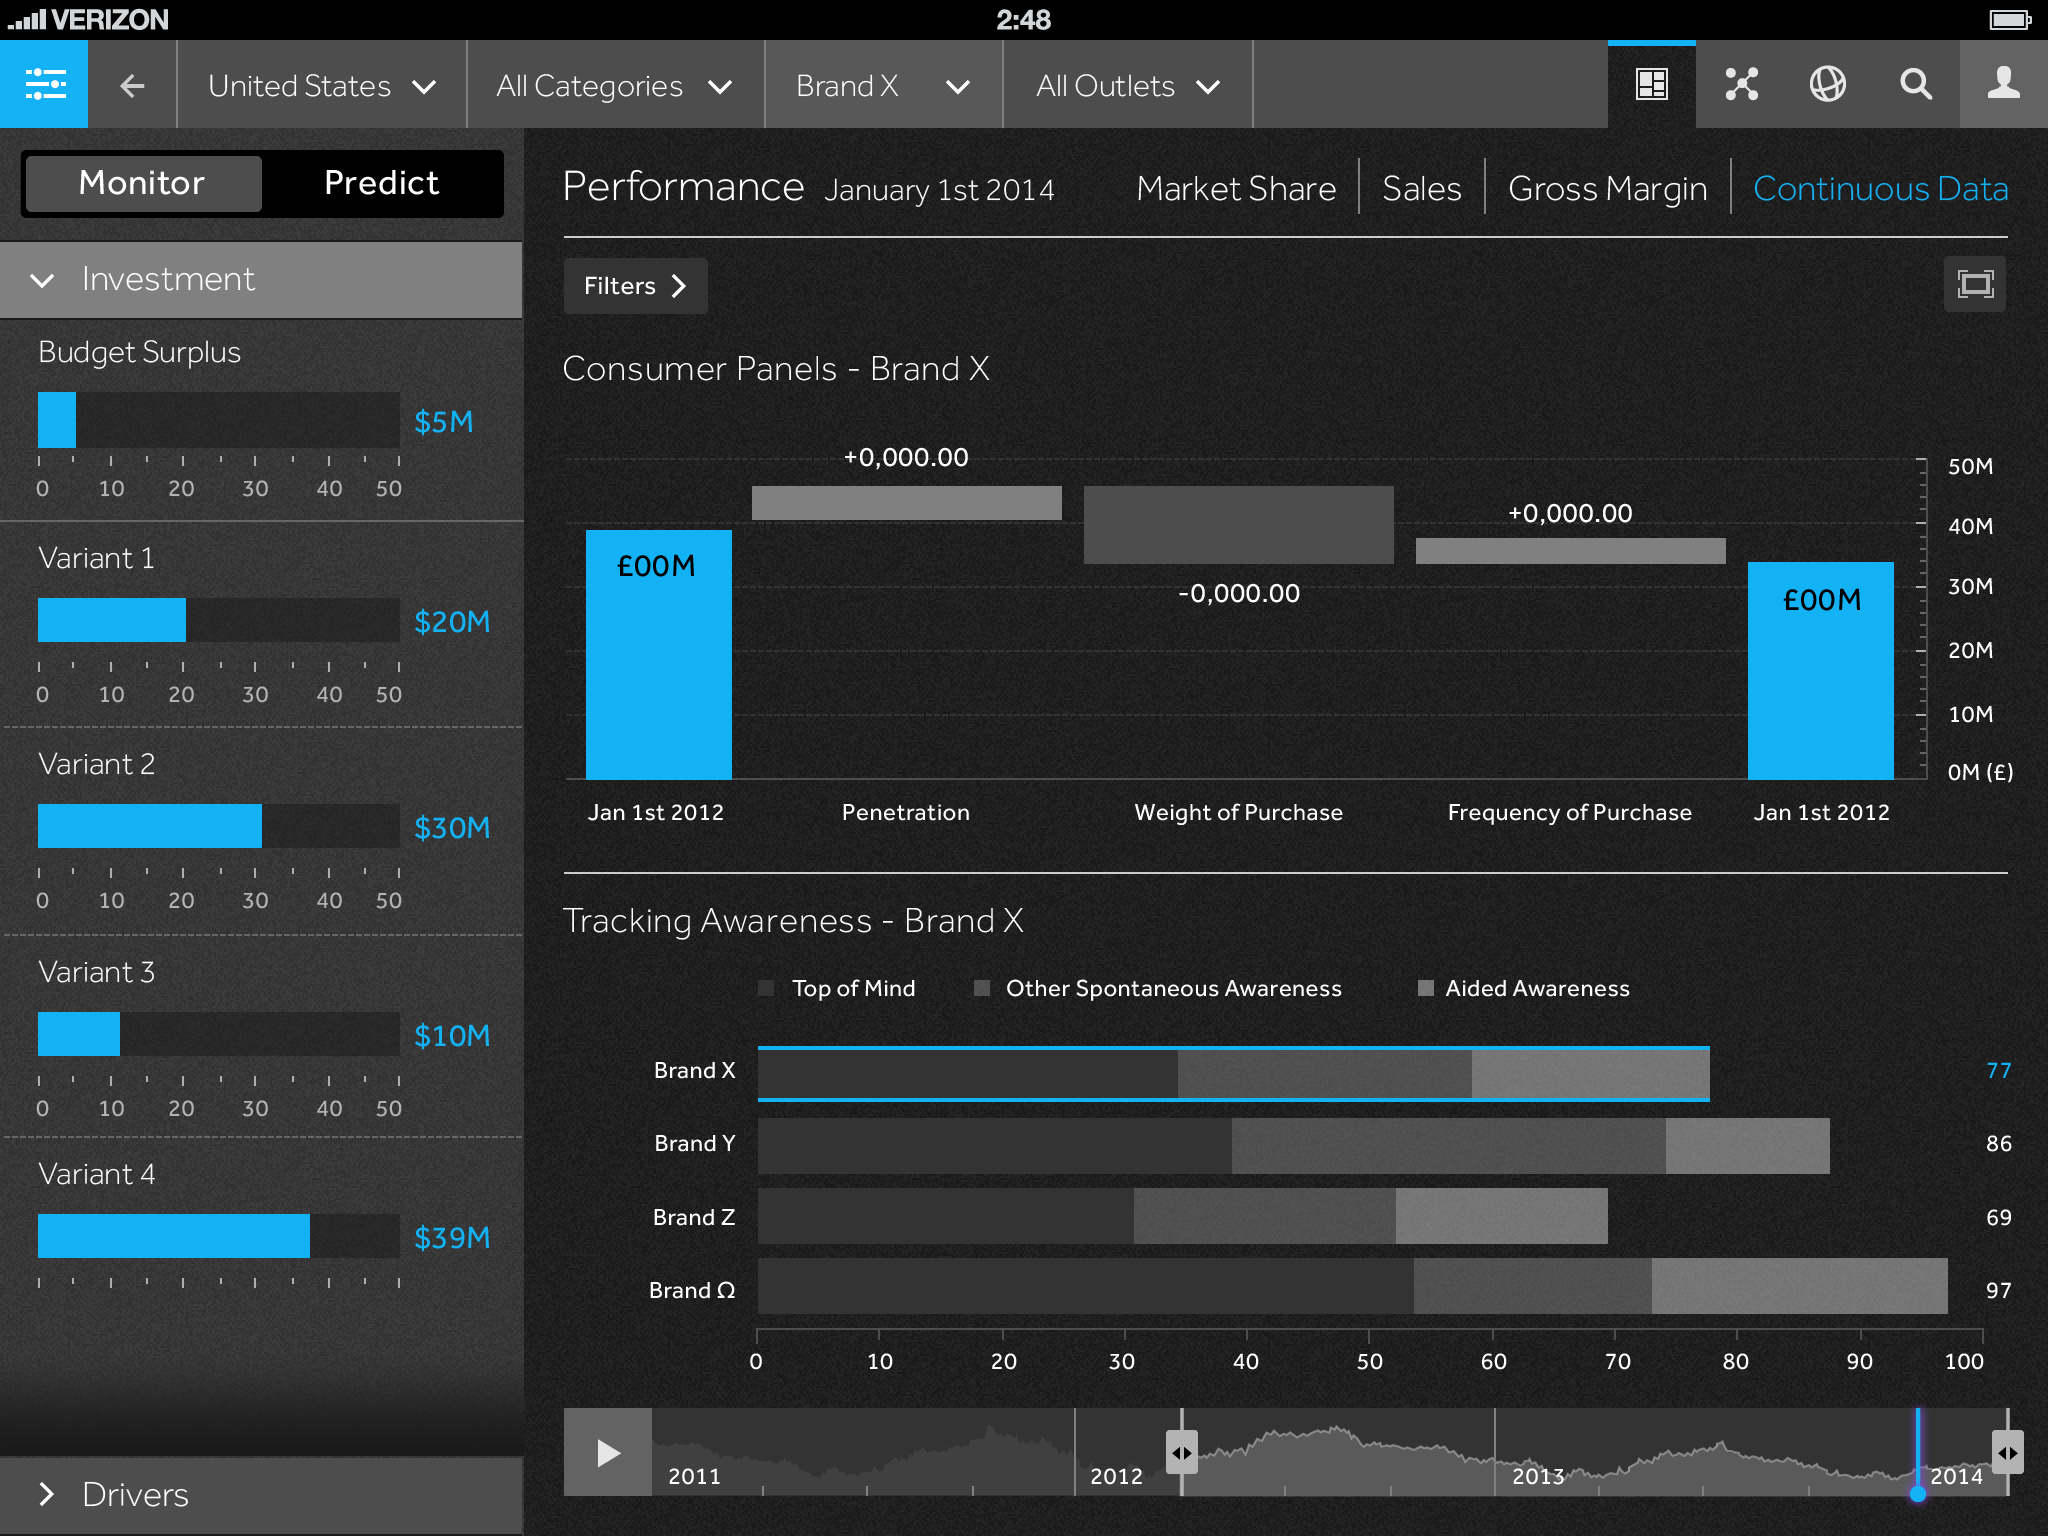
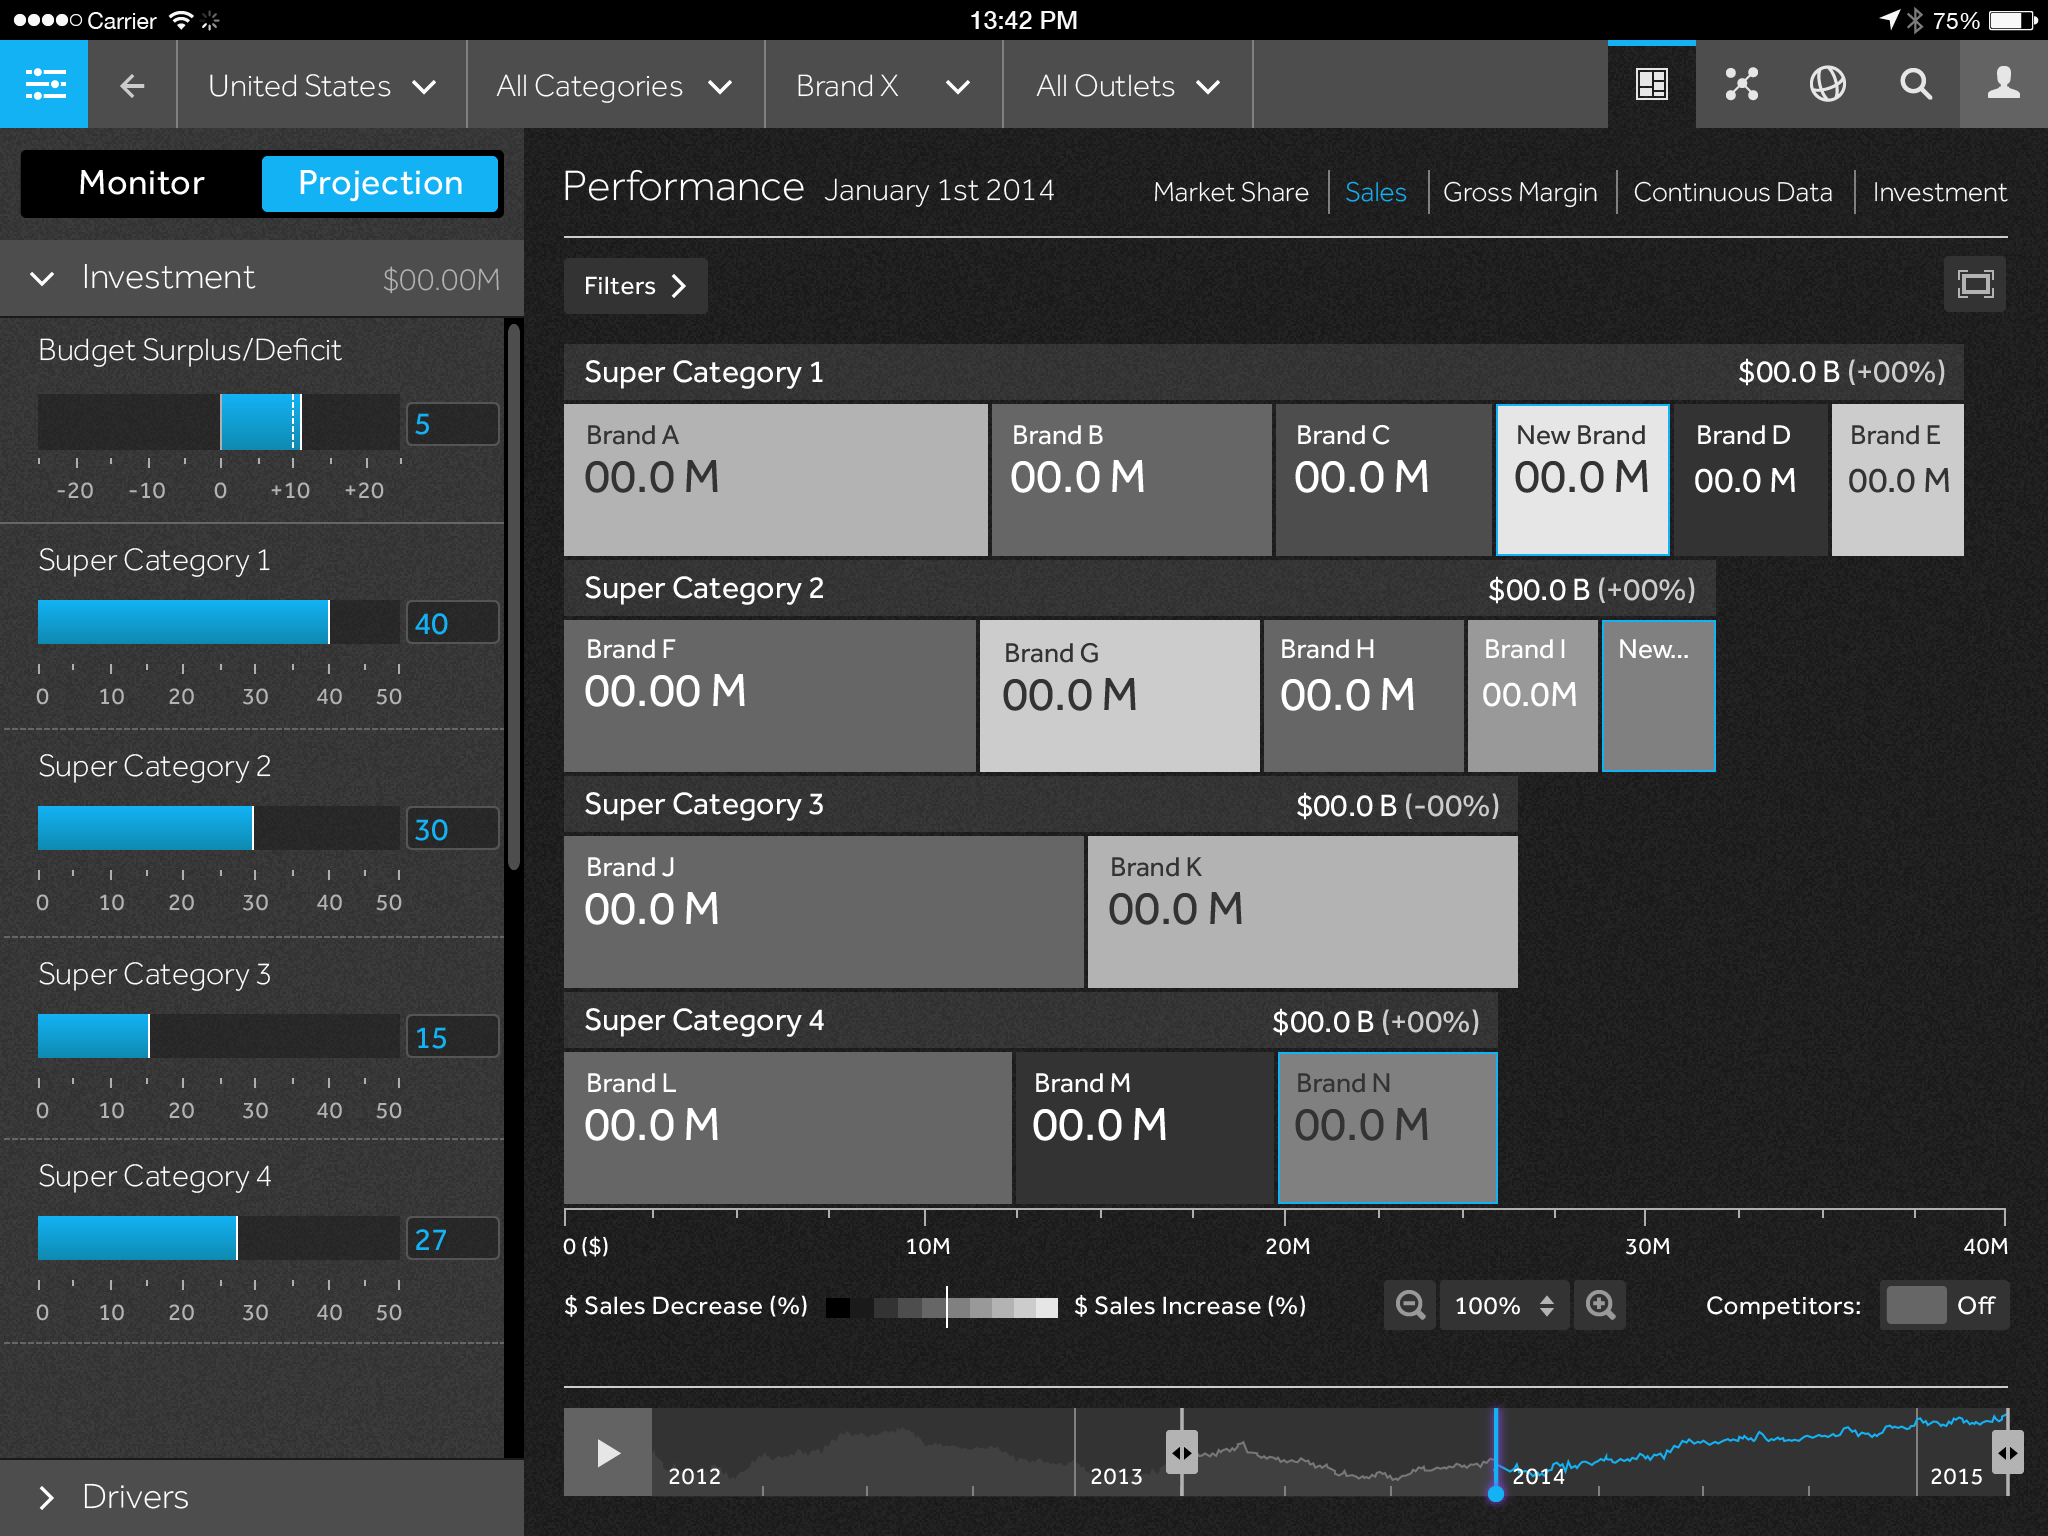
High-fidelity wireframes for key pages
![]()
![]()
![]()
![]()
Aesthetic moodboards
![]()
![]()
![]()
![]()
Moodboards for dark, light and dark+light UI aesthetics
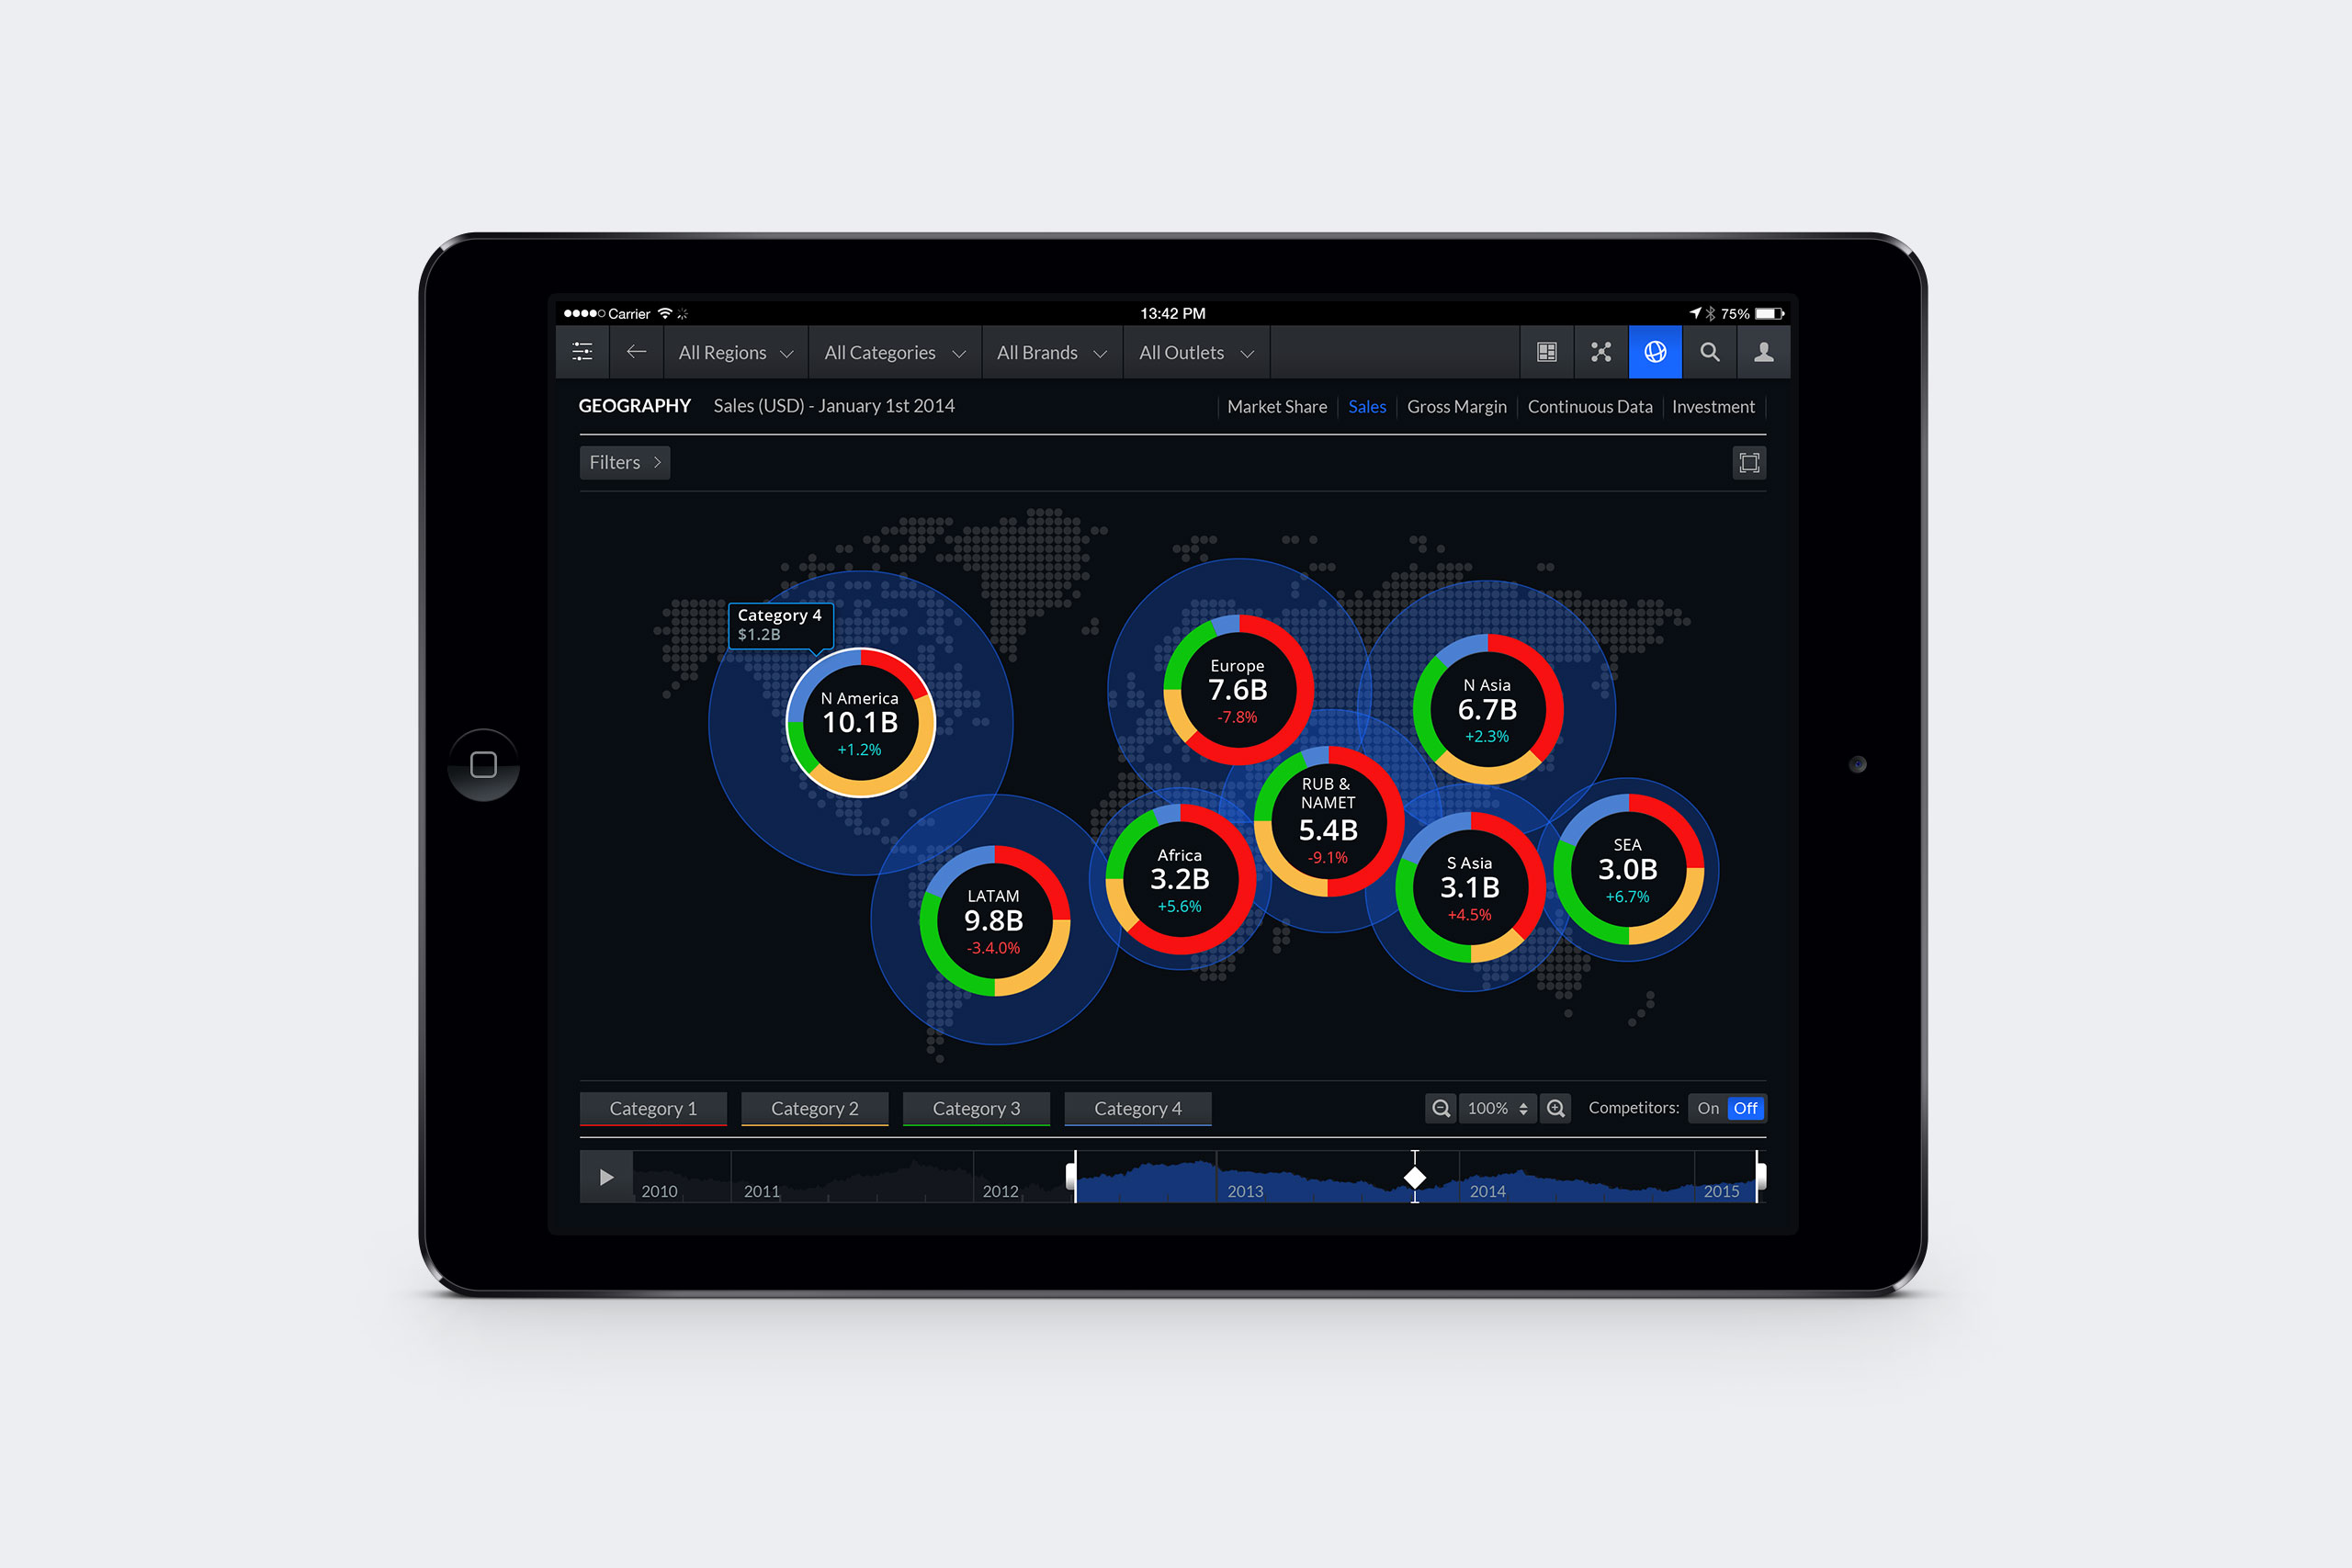 Worldwide overview
 Viewing the performance of a particular brand category
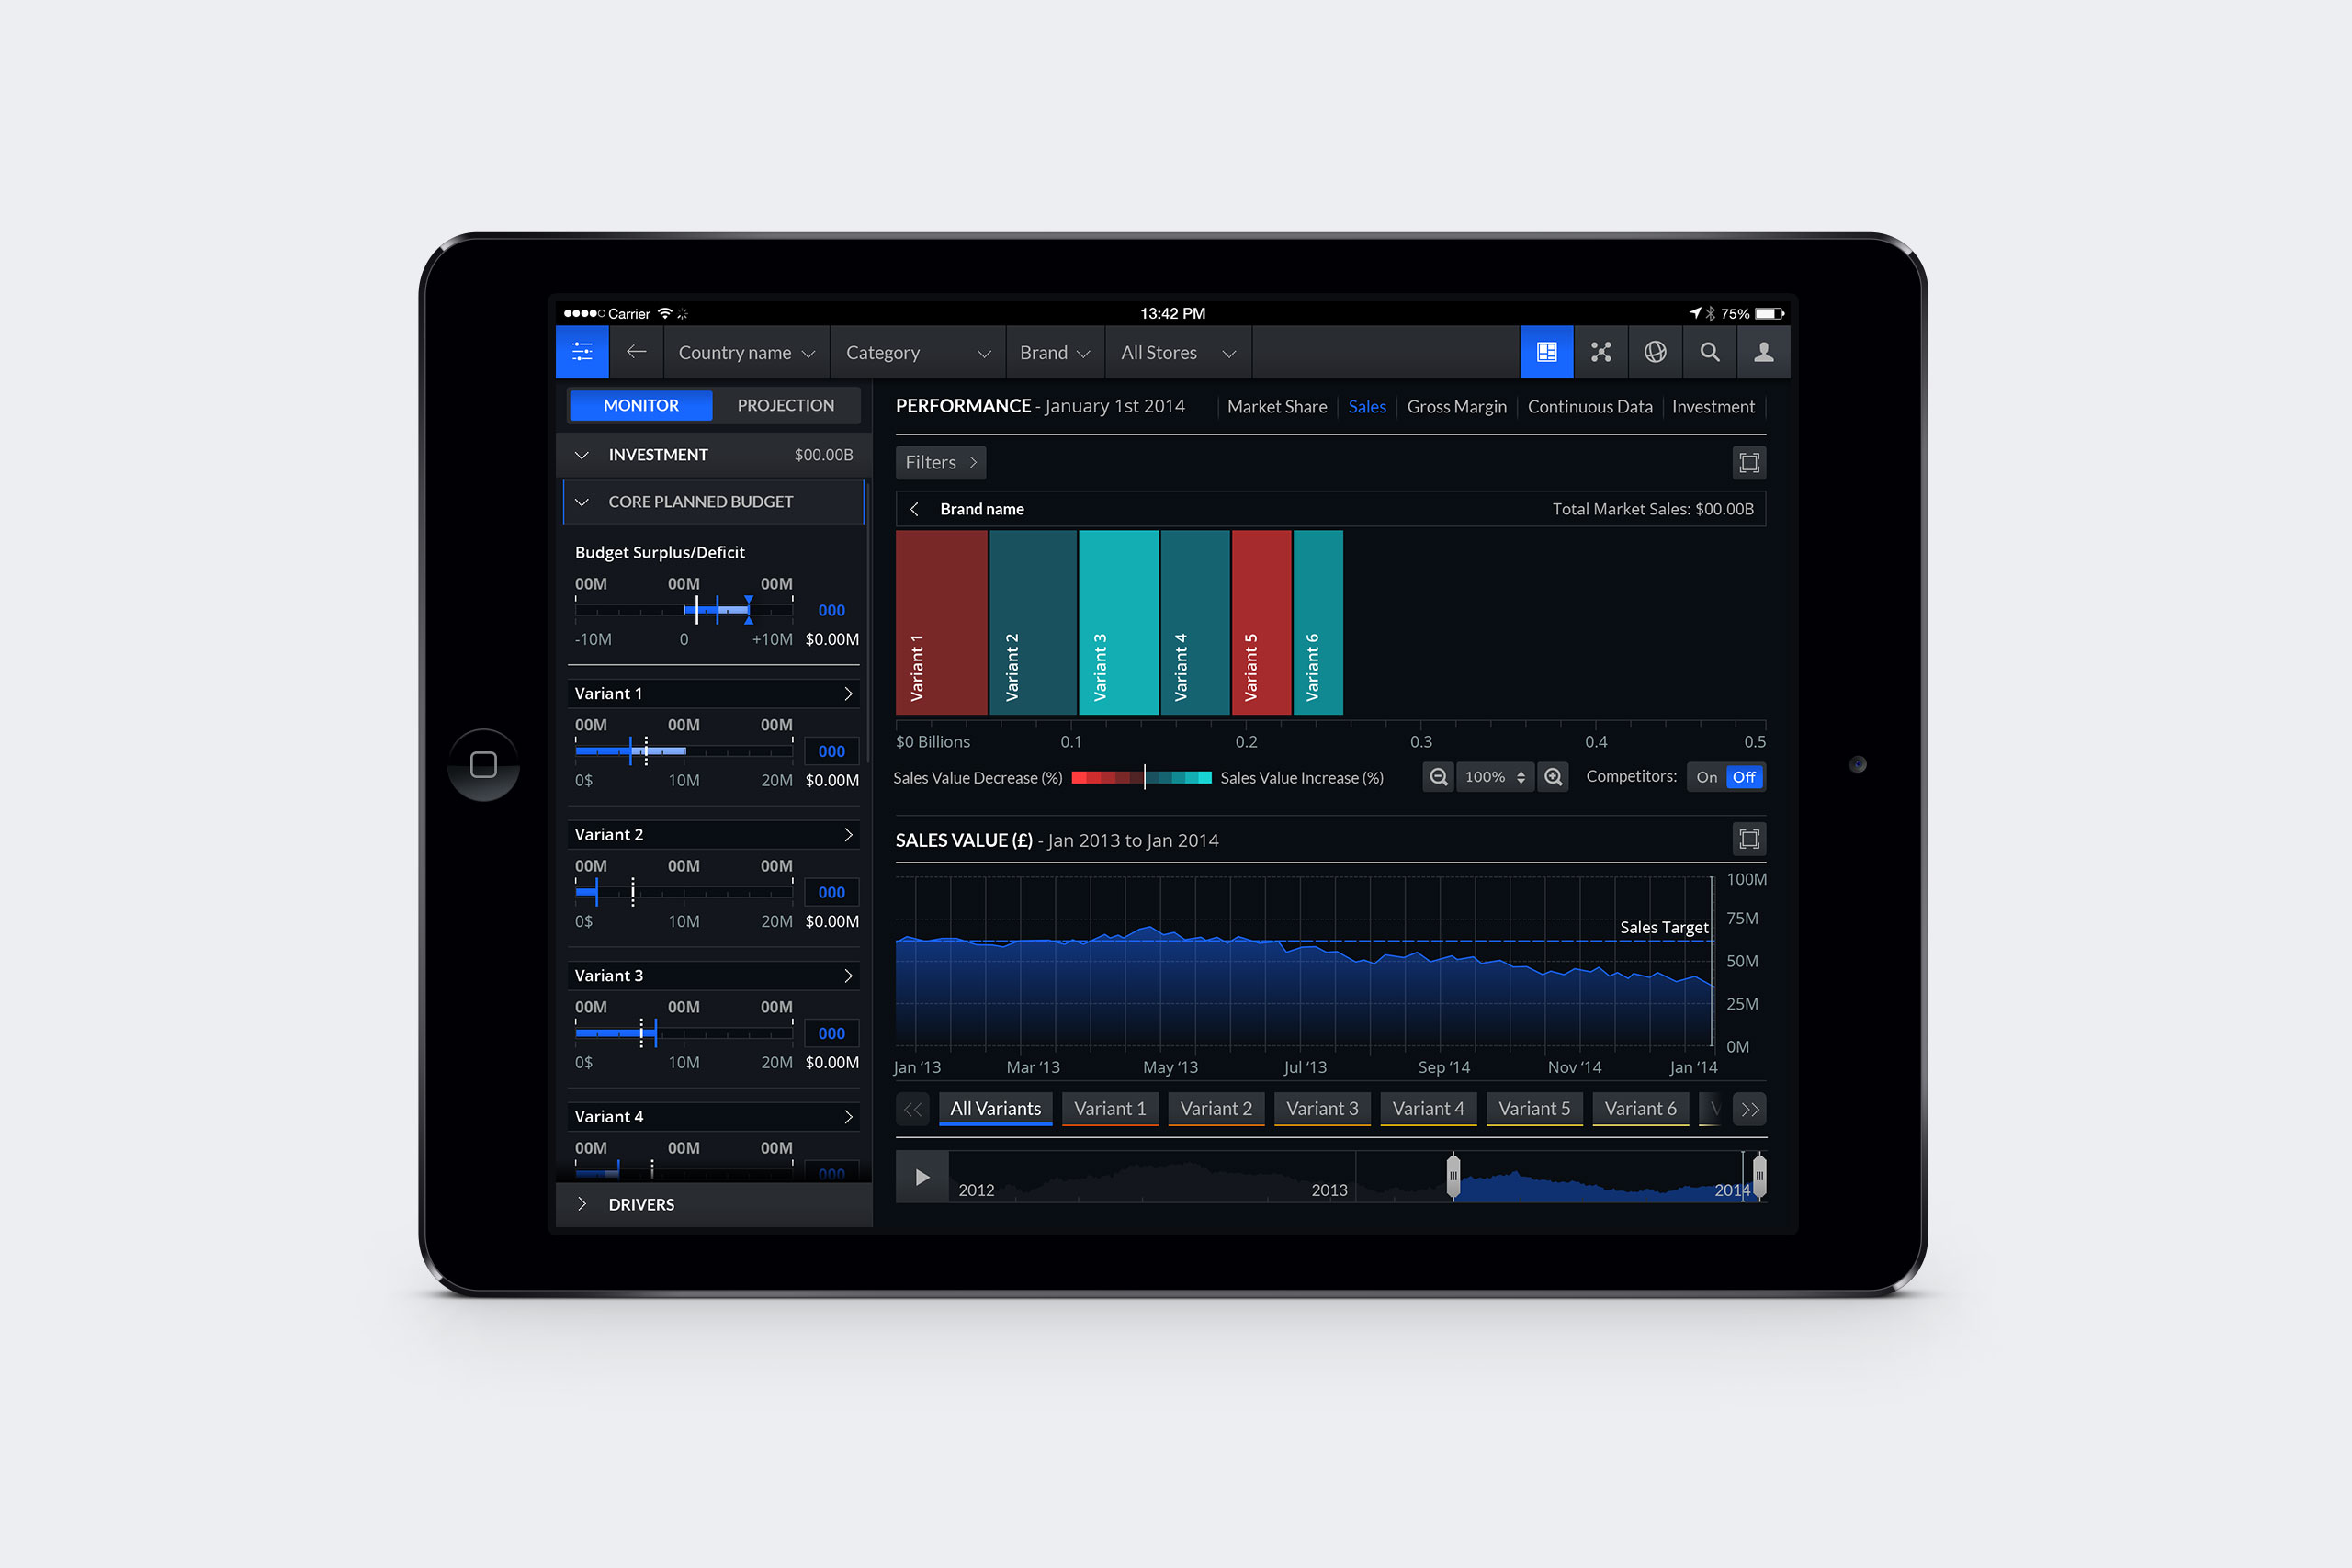 Viewing the sales value vs. target over time for a particular brand
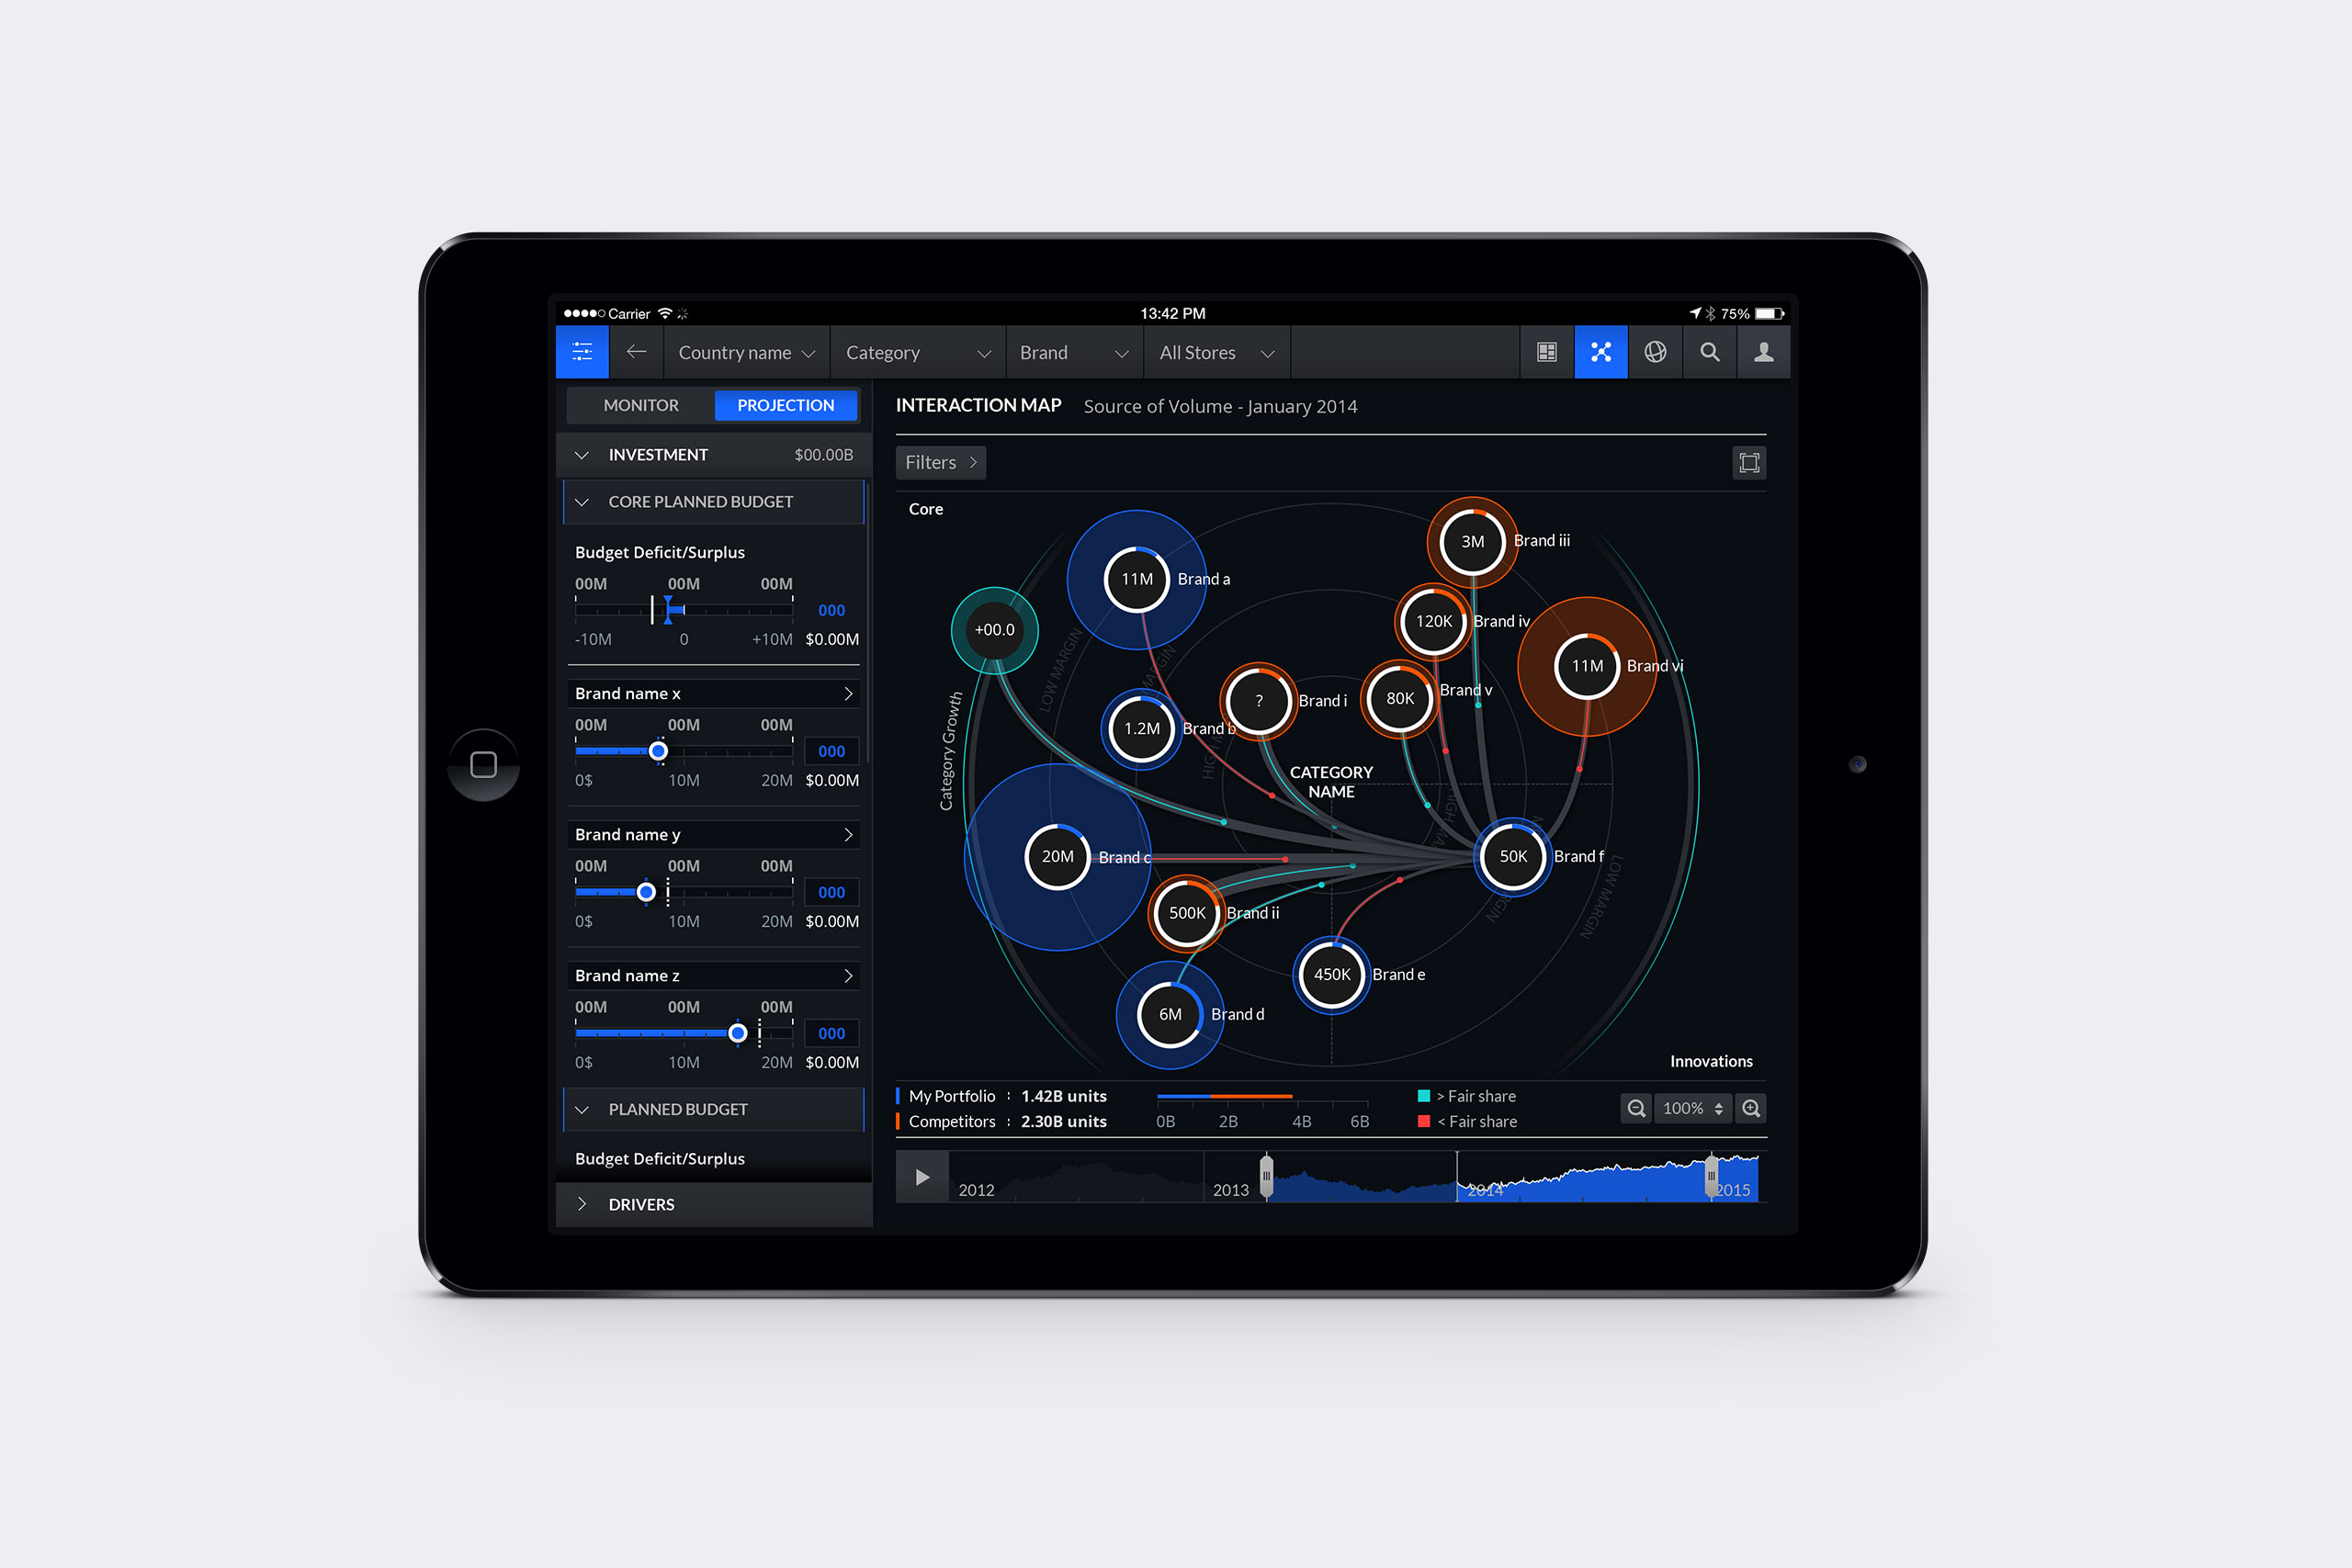 An interaction map showing how sales shift between brands over time, including new brand launches
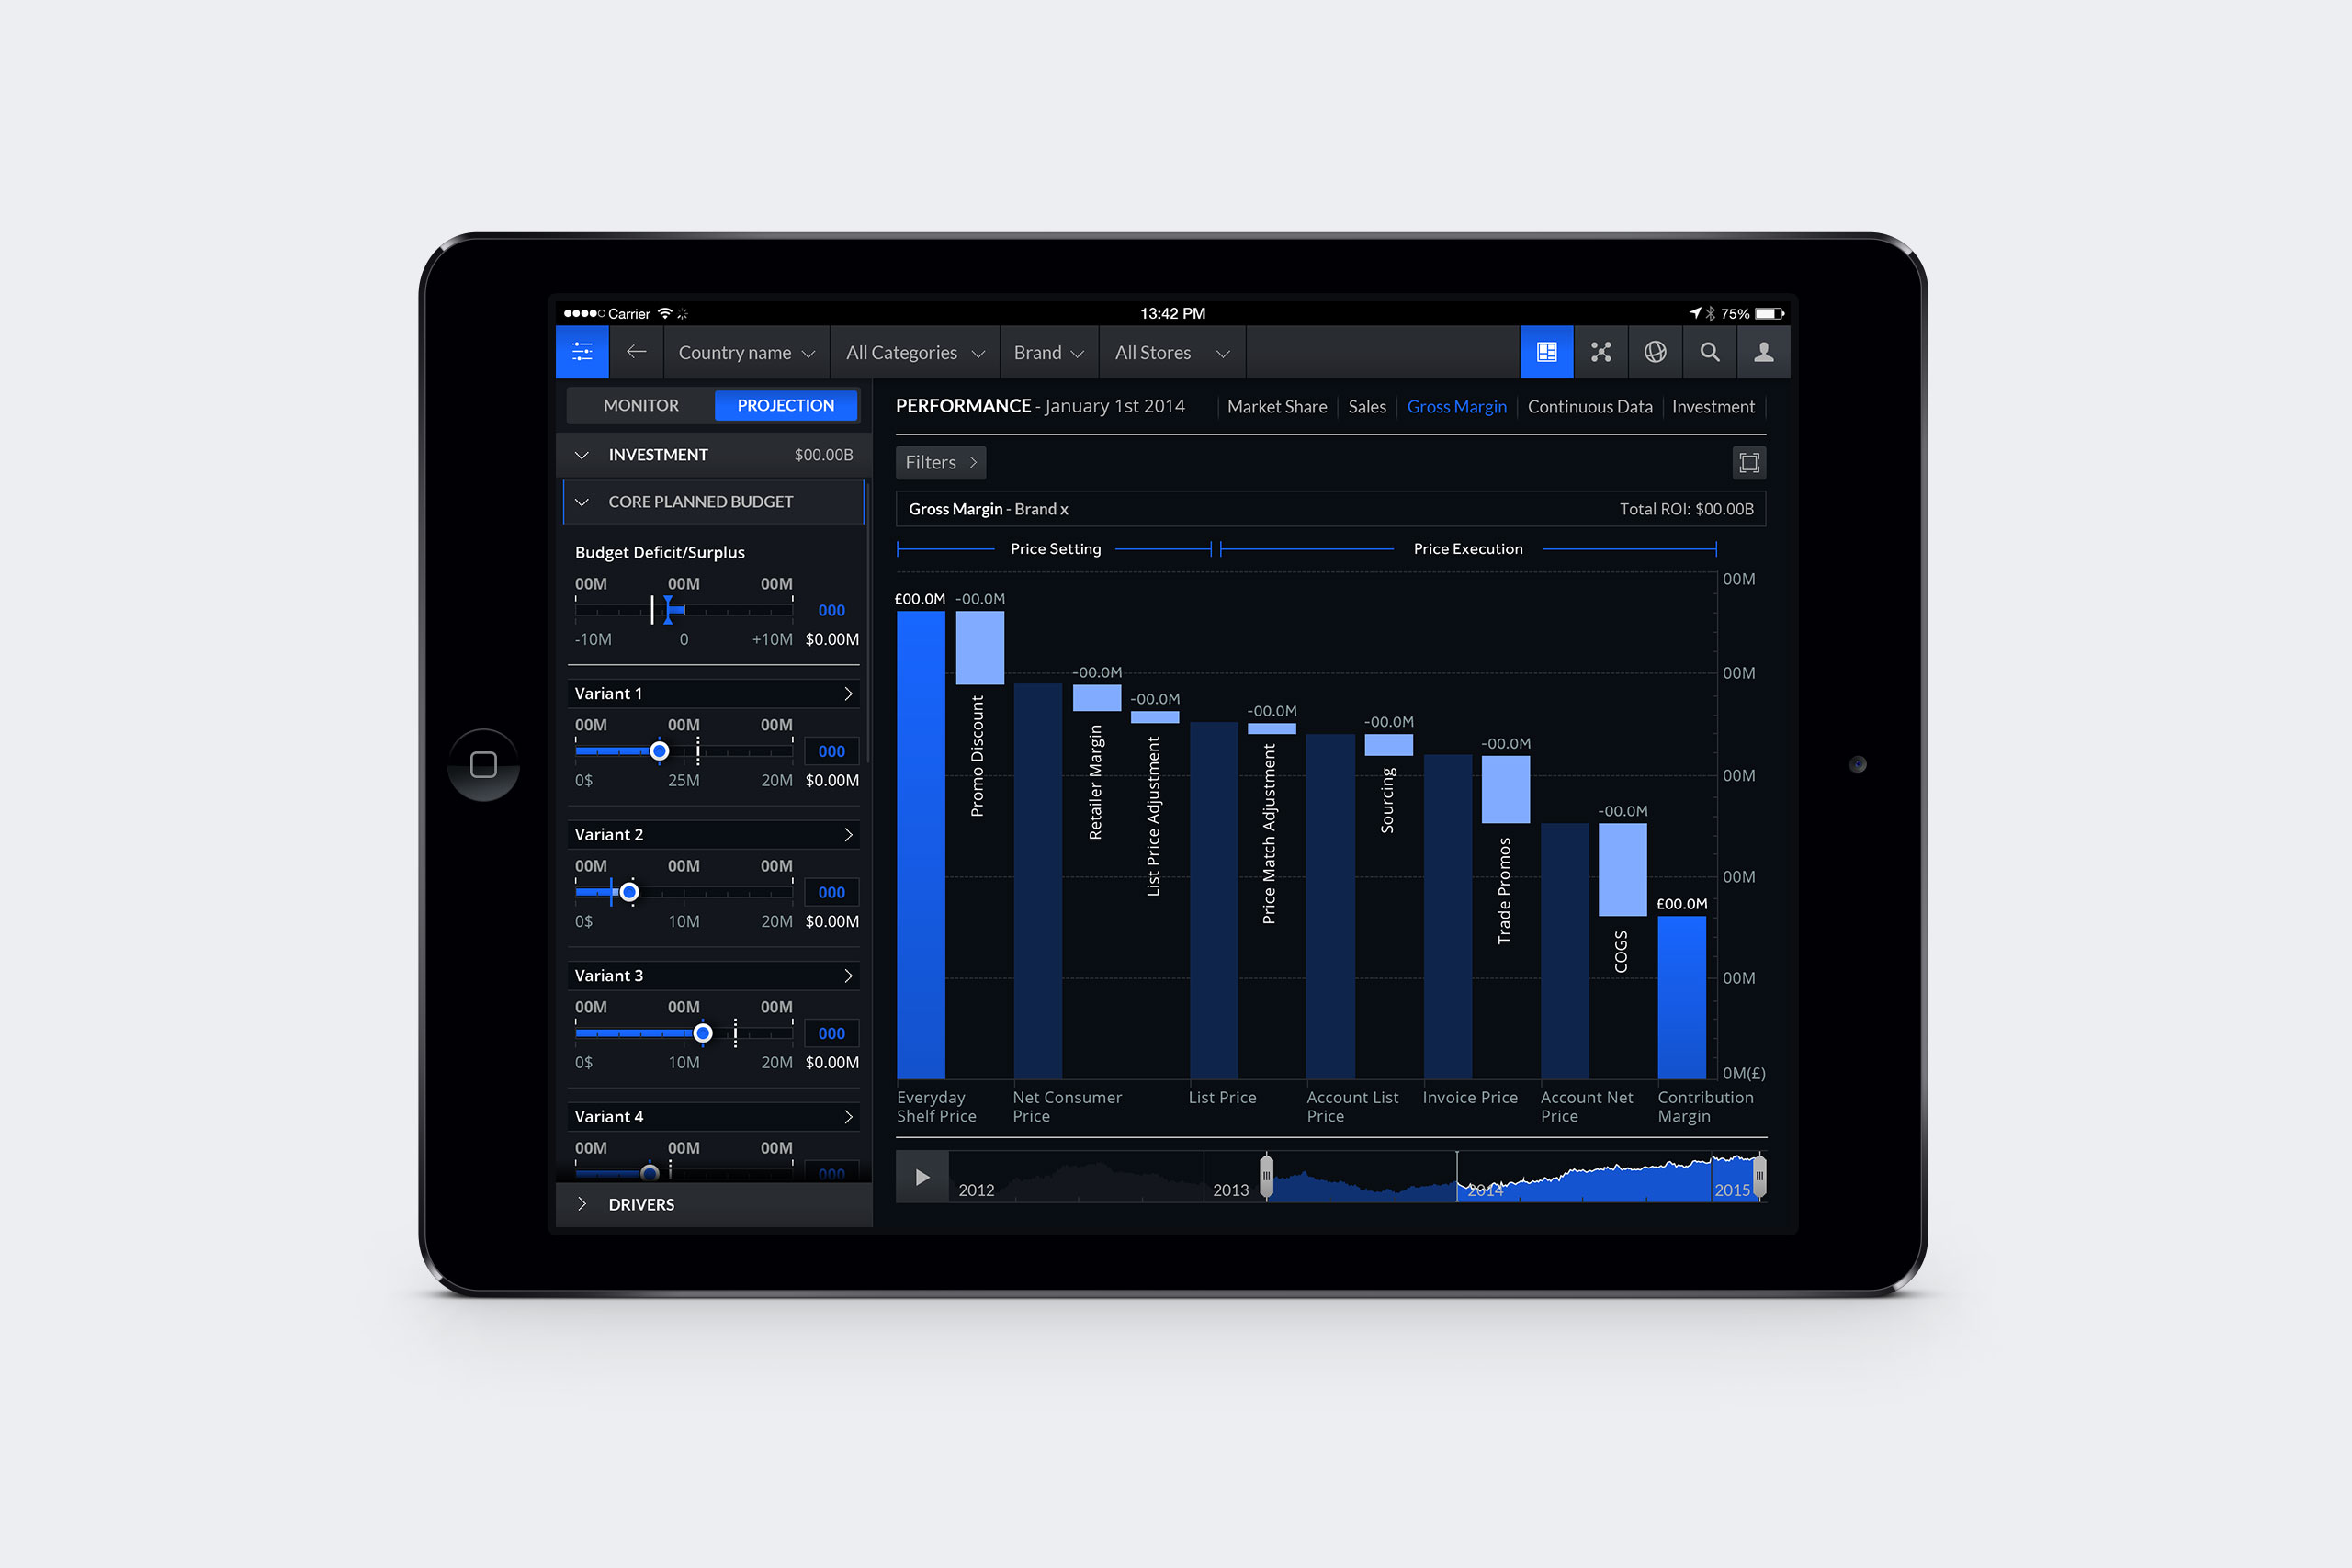 Waterfall chart showing the gross margin for a specific brand
 Tree map showing market share for a product category
 Charts showing sales value increase/decrease compared to total sales
Visual Design Reference for Dev
High-fidelity wireframes for key pages

Aesthetic moodboards
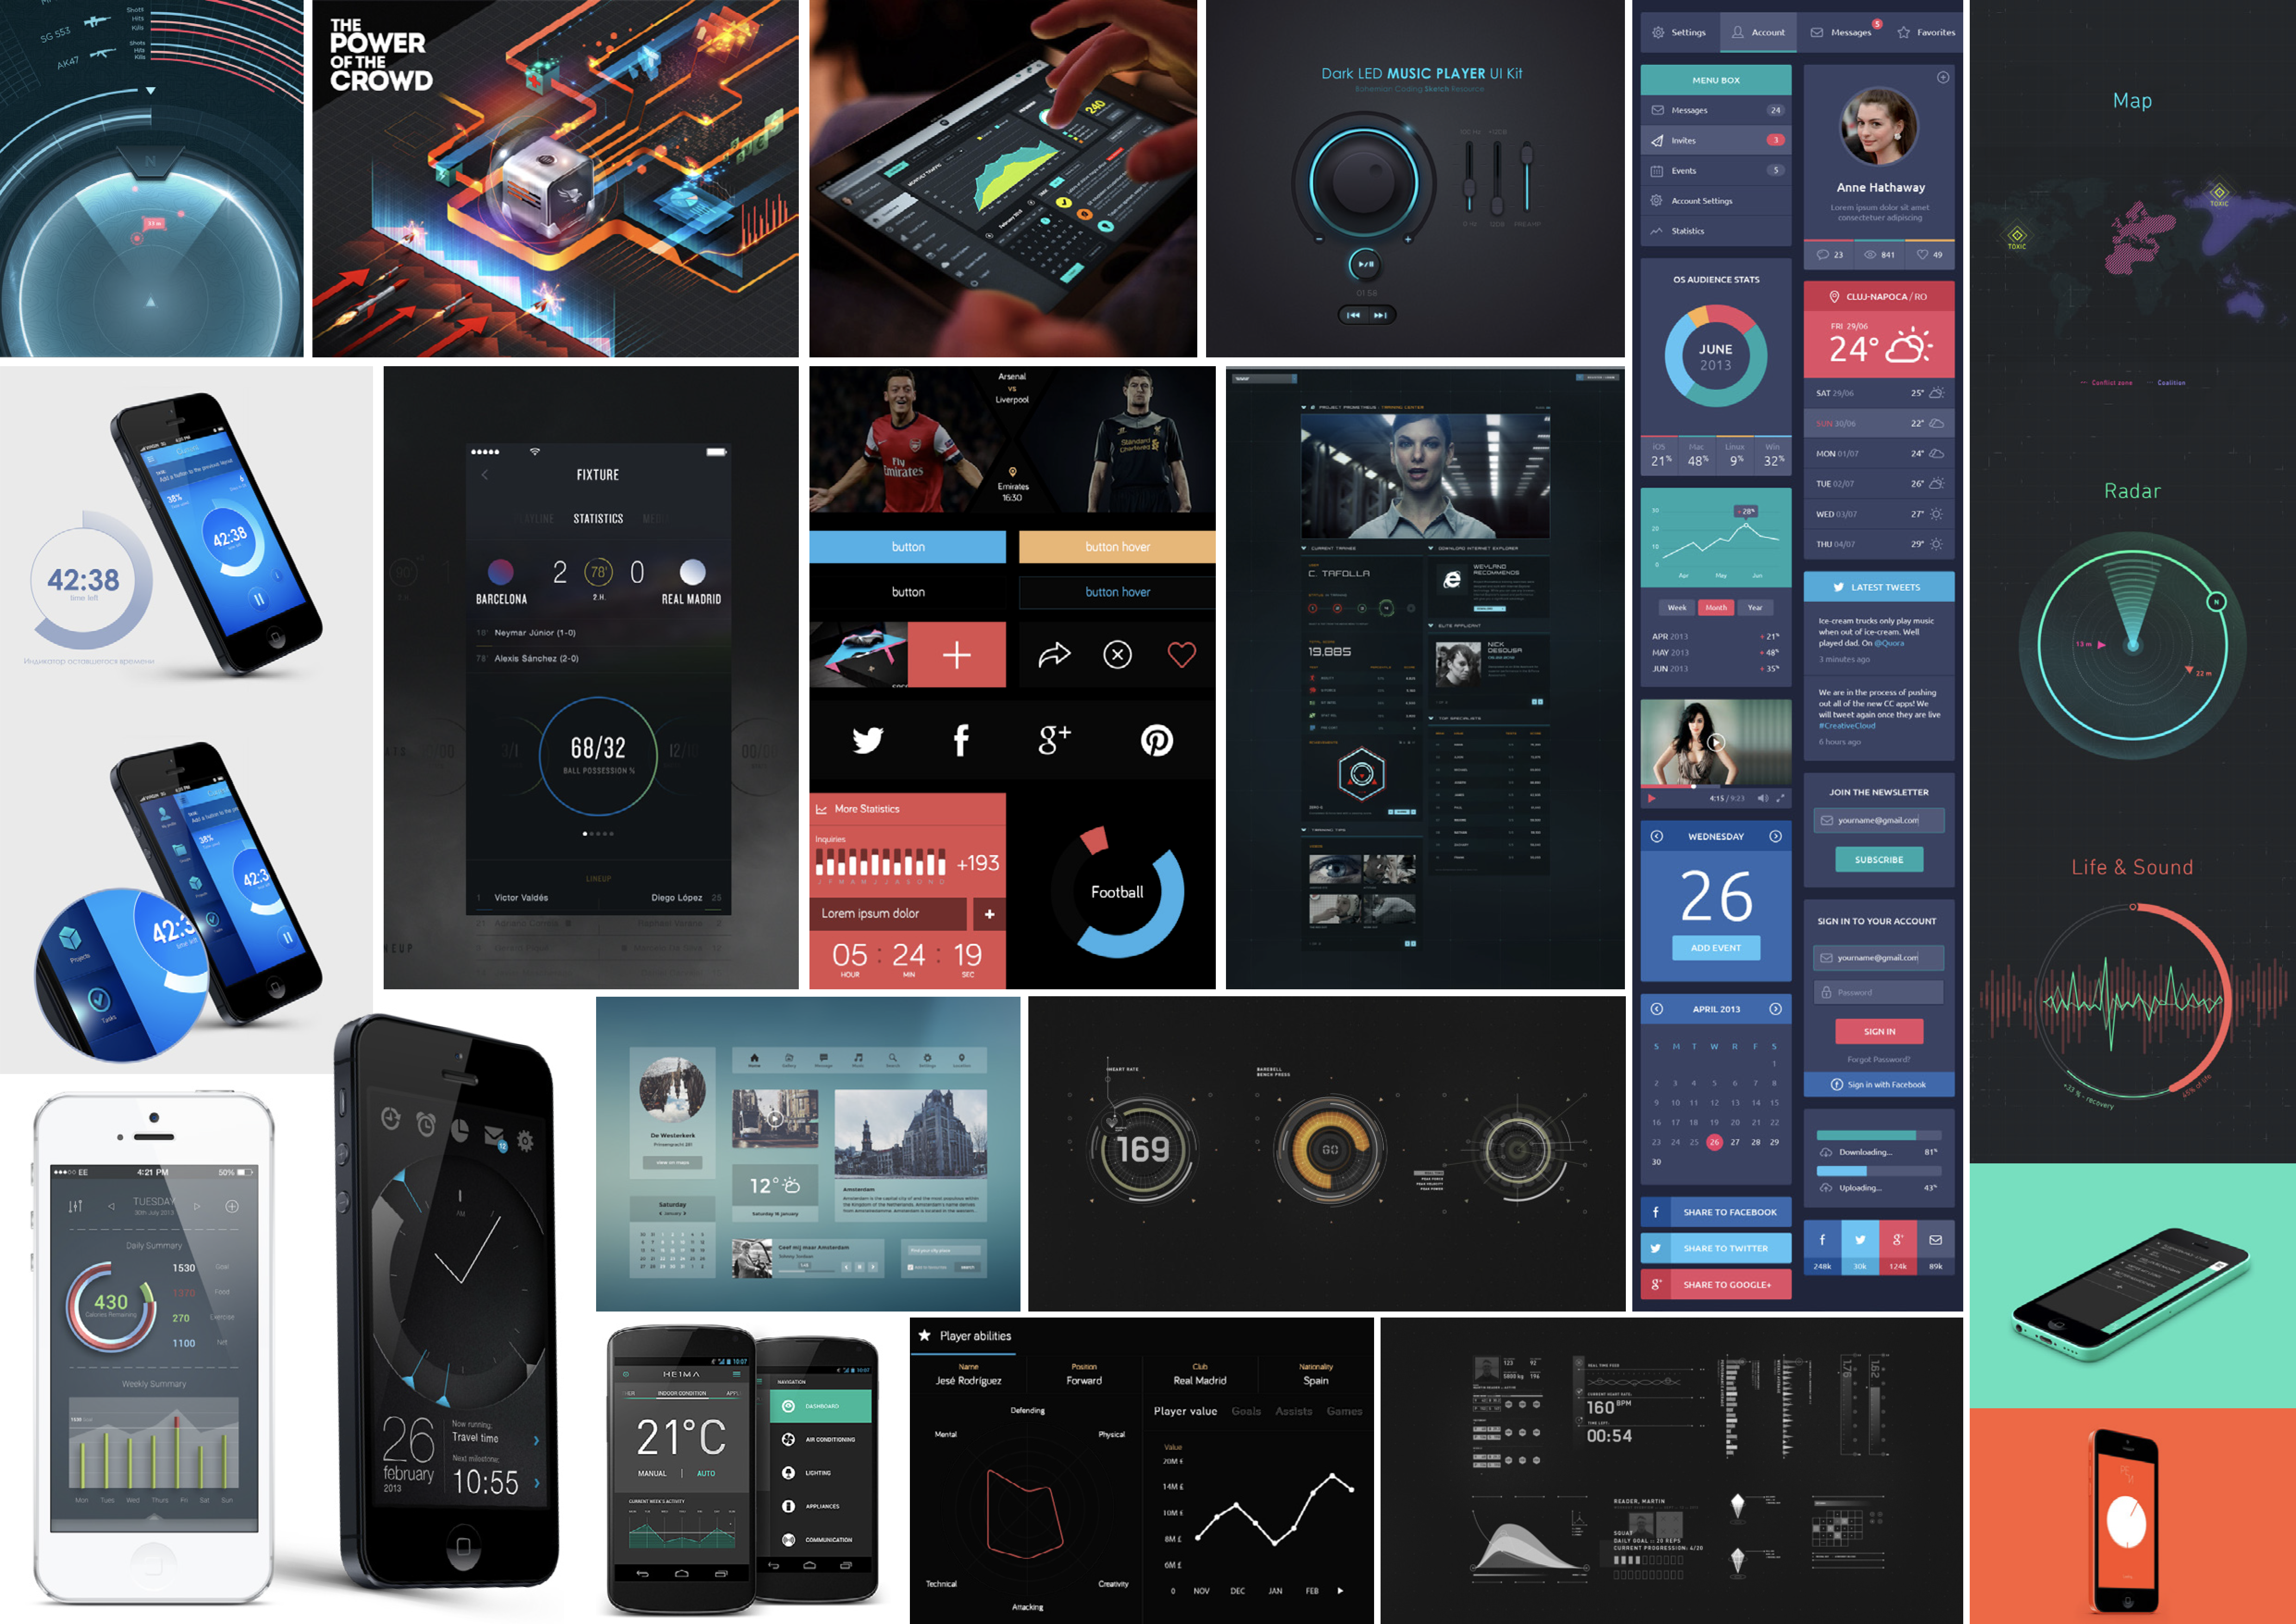

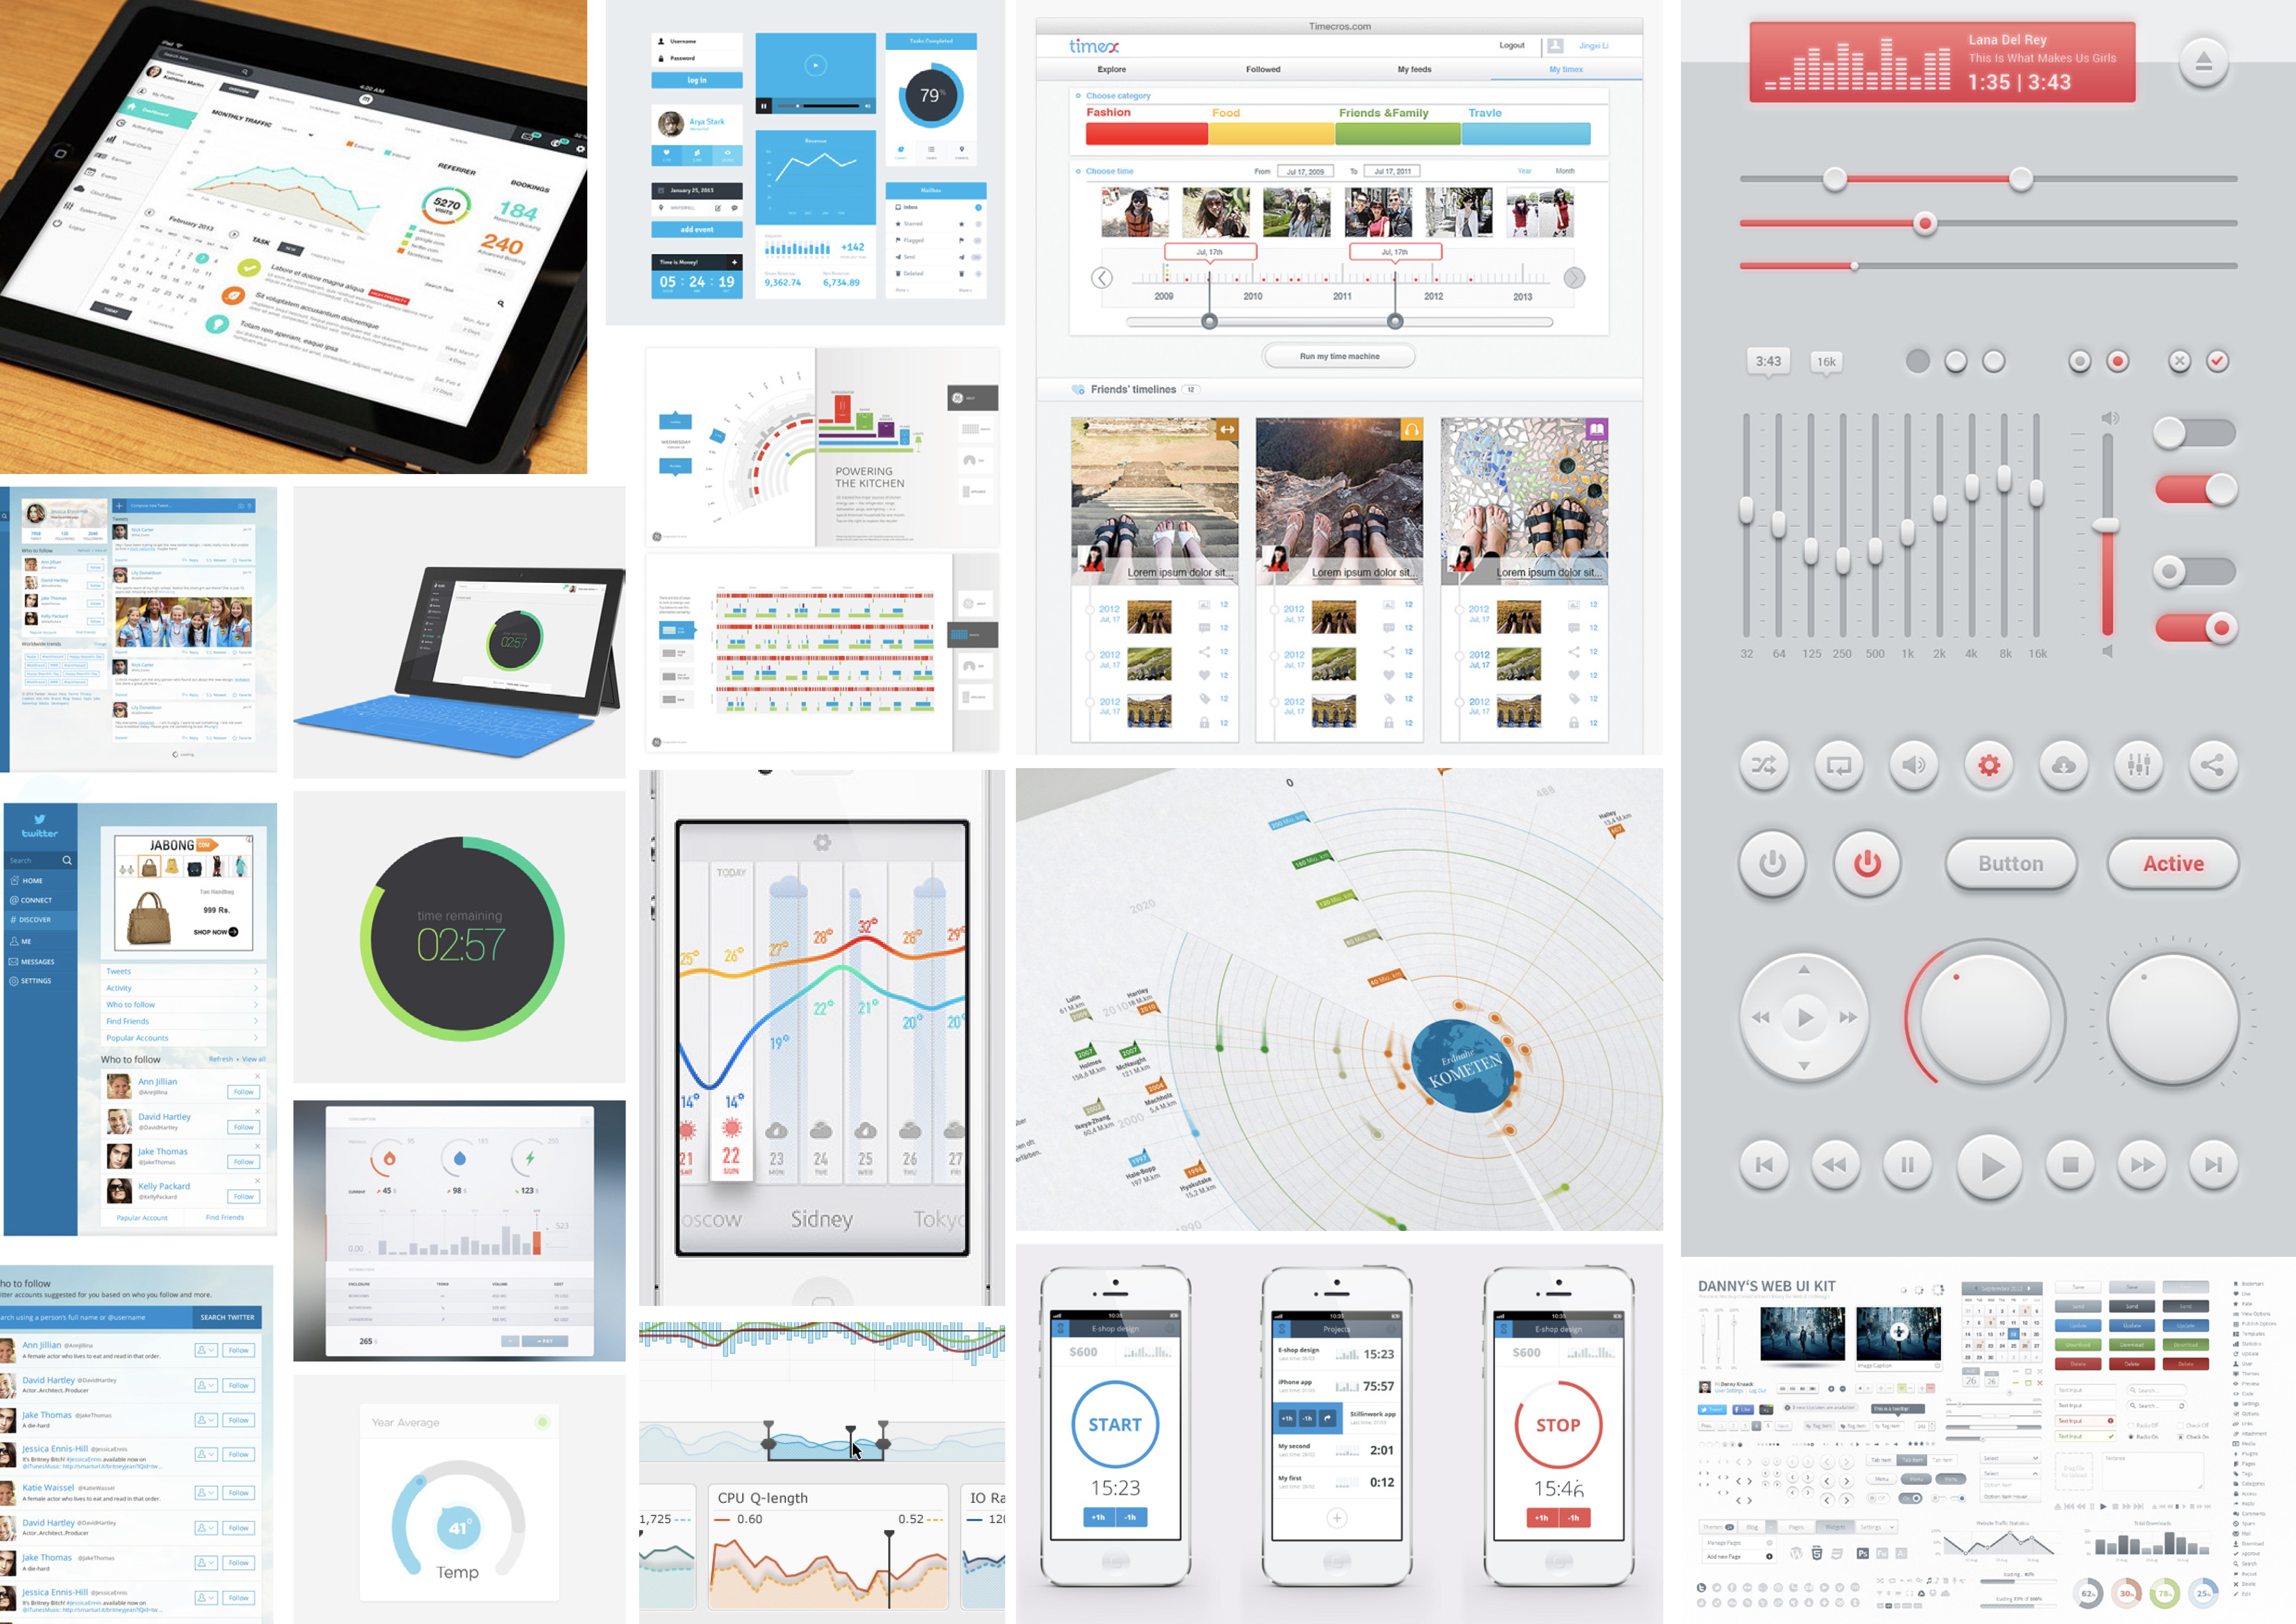
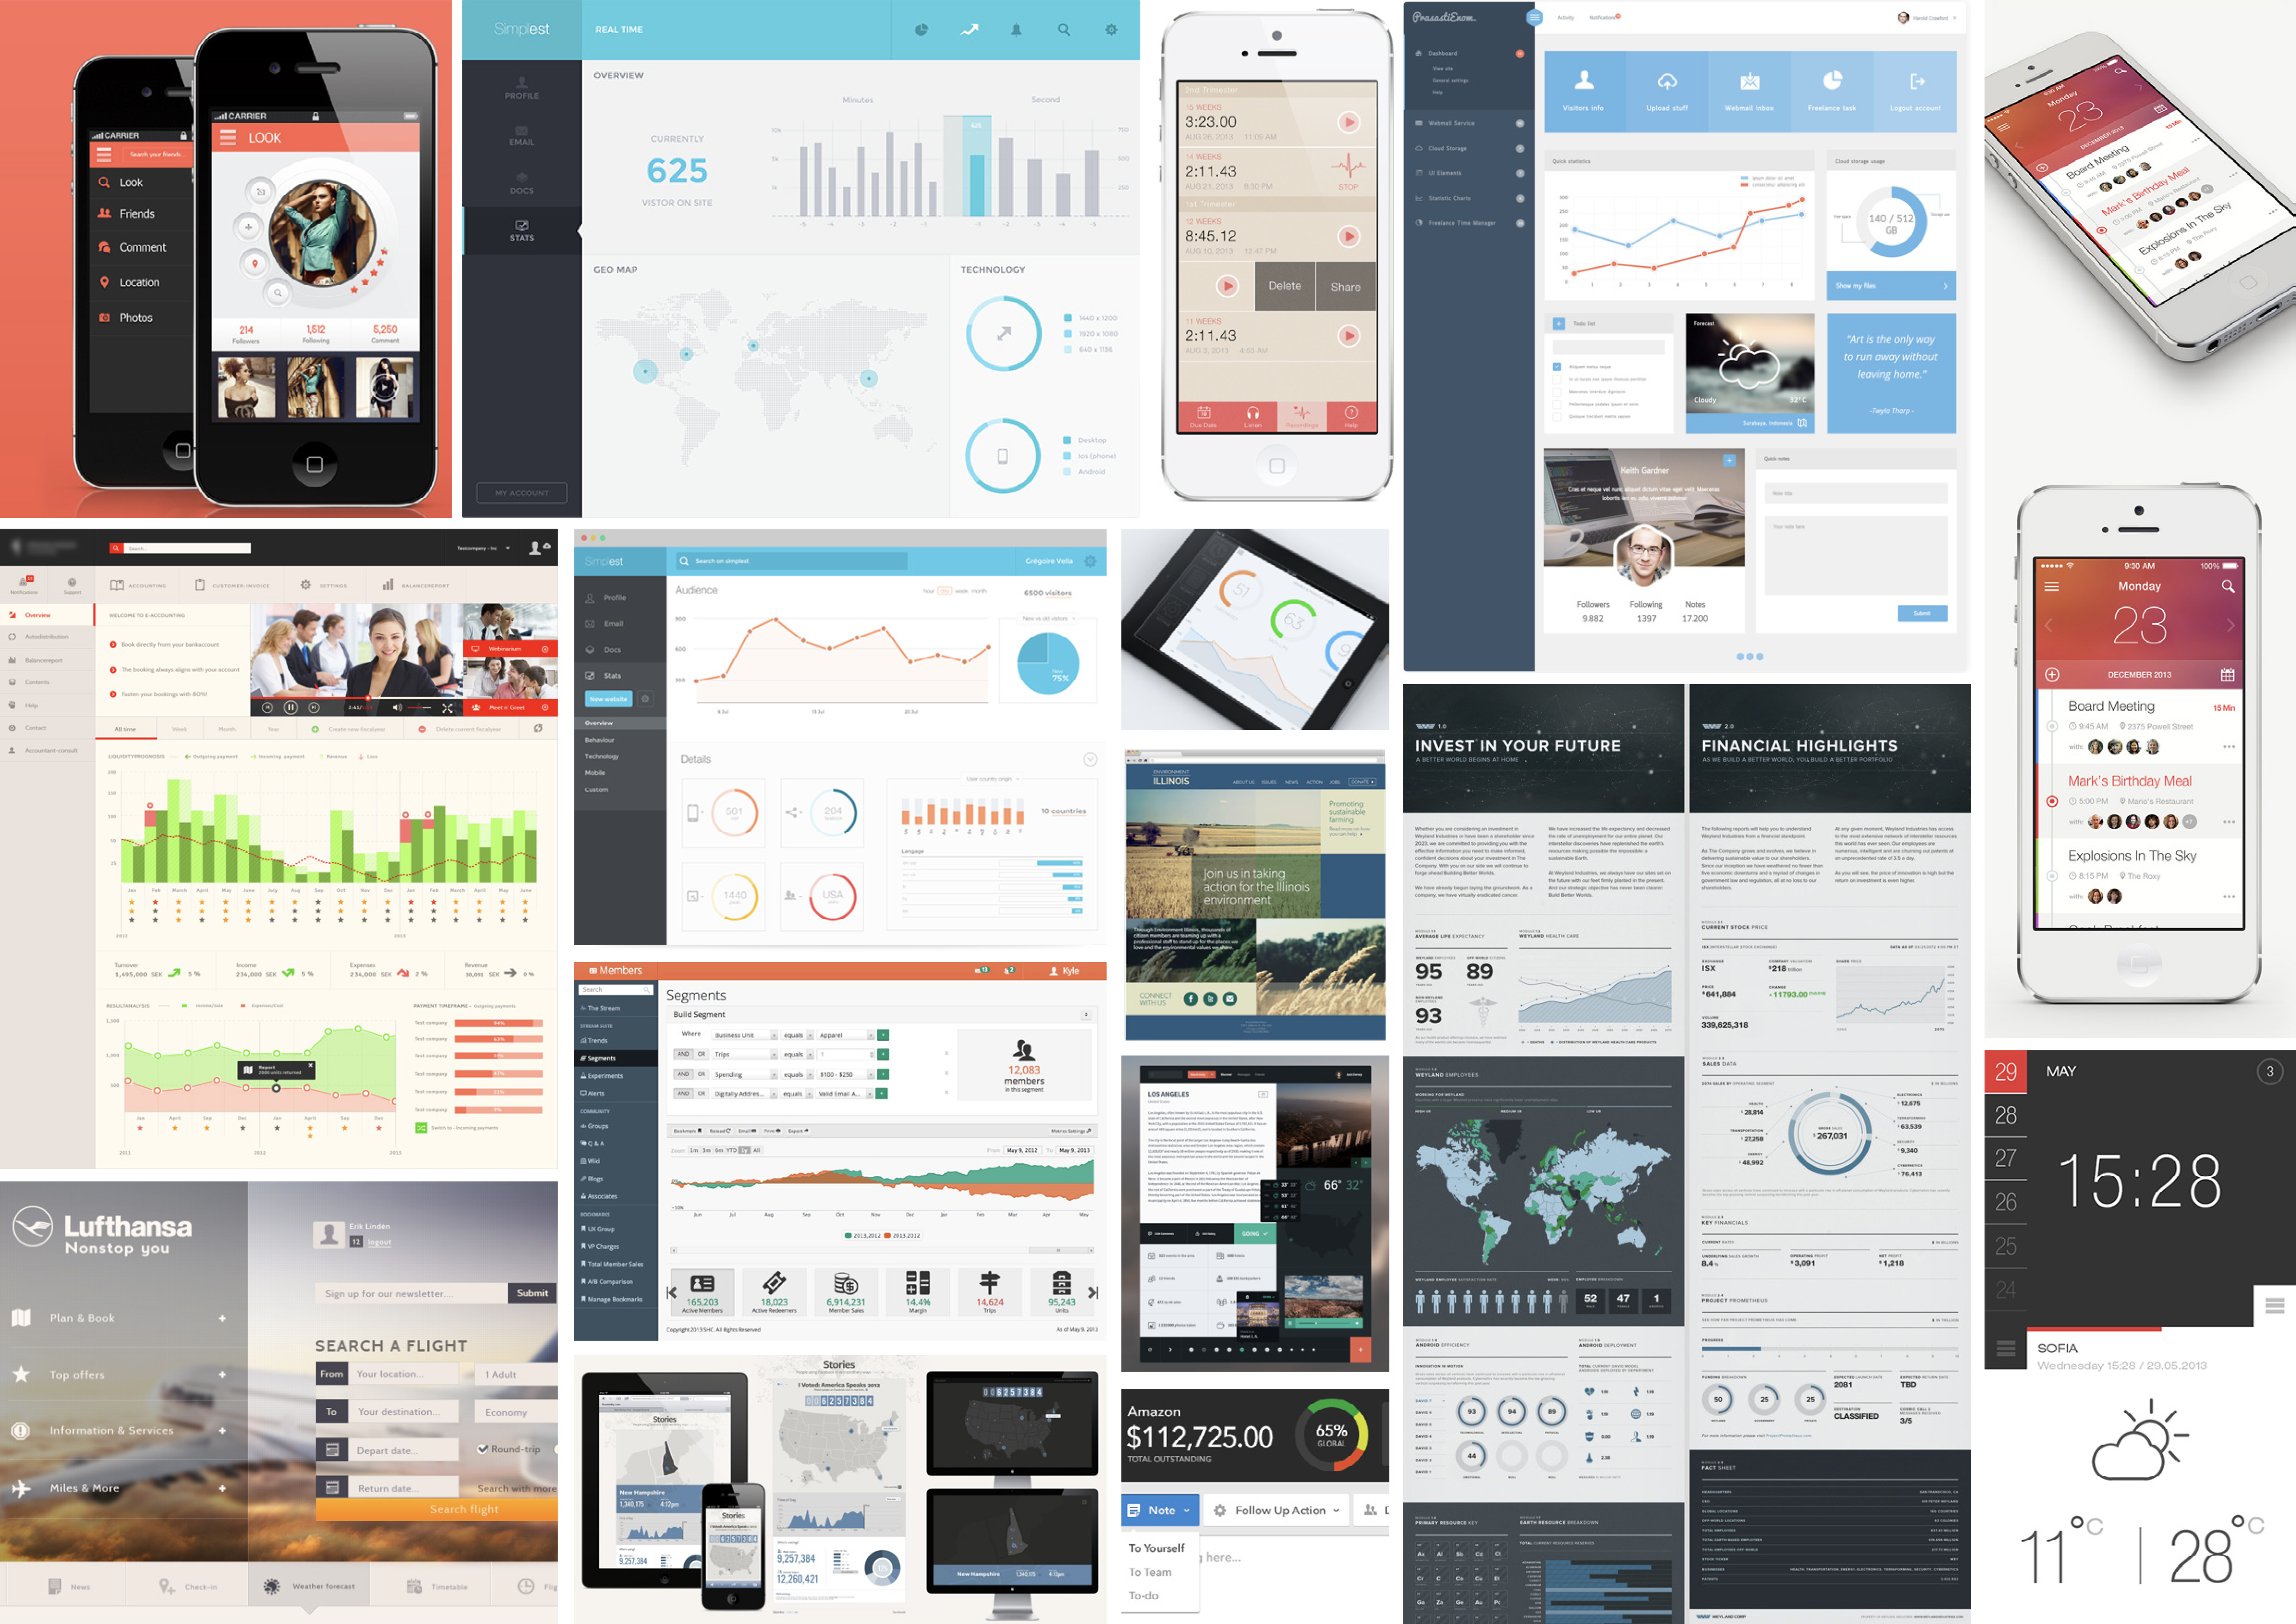
Moodboards for dark, light and dark+light UI aesthetics