North Greenwich: Data Walking Sound Visualization
Client: David Hunter Design
Year: 2016
Data Processing: Ottis Kelleghan
d3 Code Review: Lucia Kocincova
Thanks to David Hunter for inviting me to be part of the project.
Data Walking is a research project by David Hunter to collect environmental data while walking around North Greenwich, to build a rich picture of that area over time.
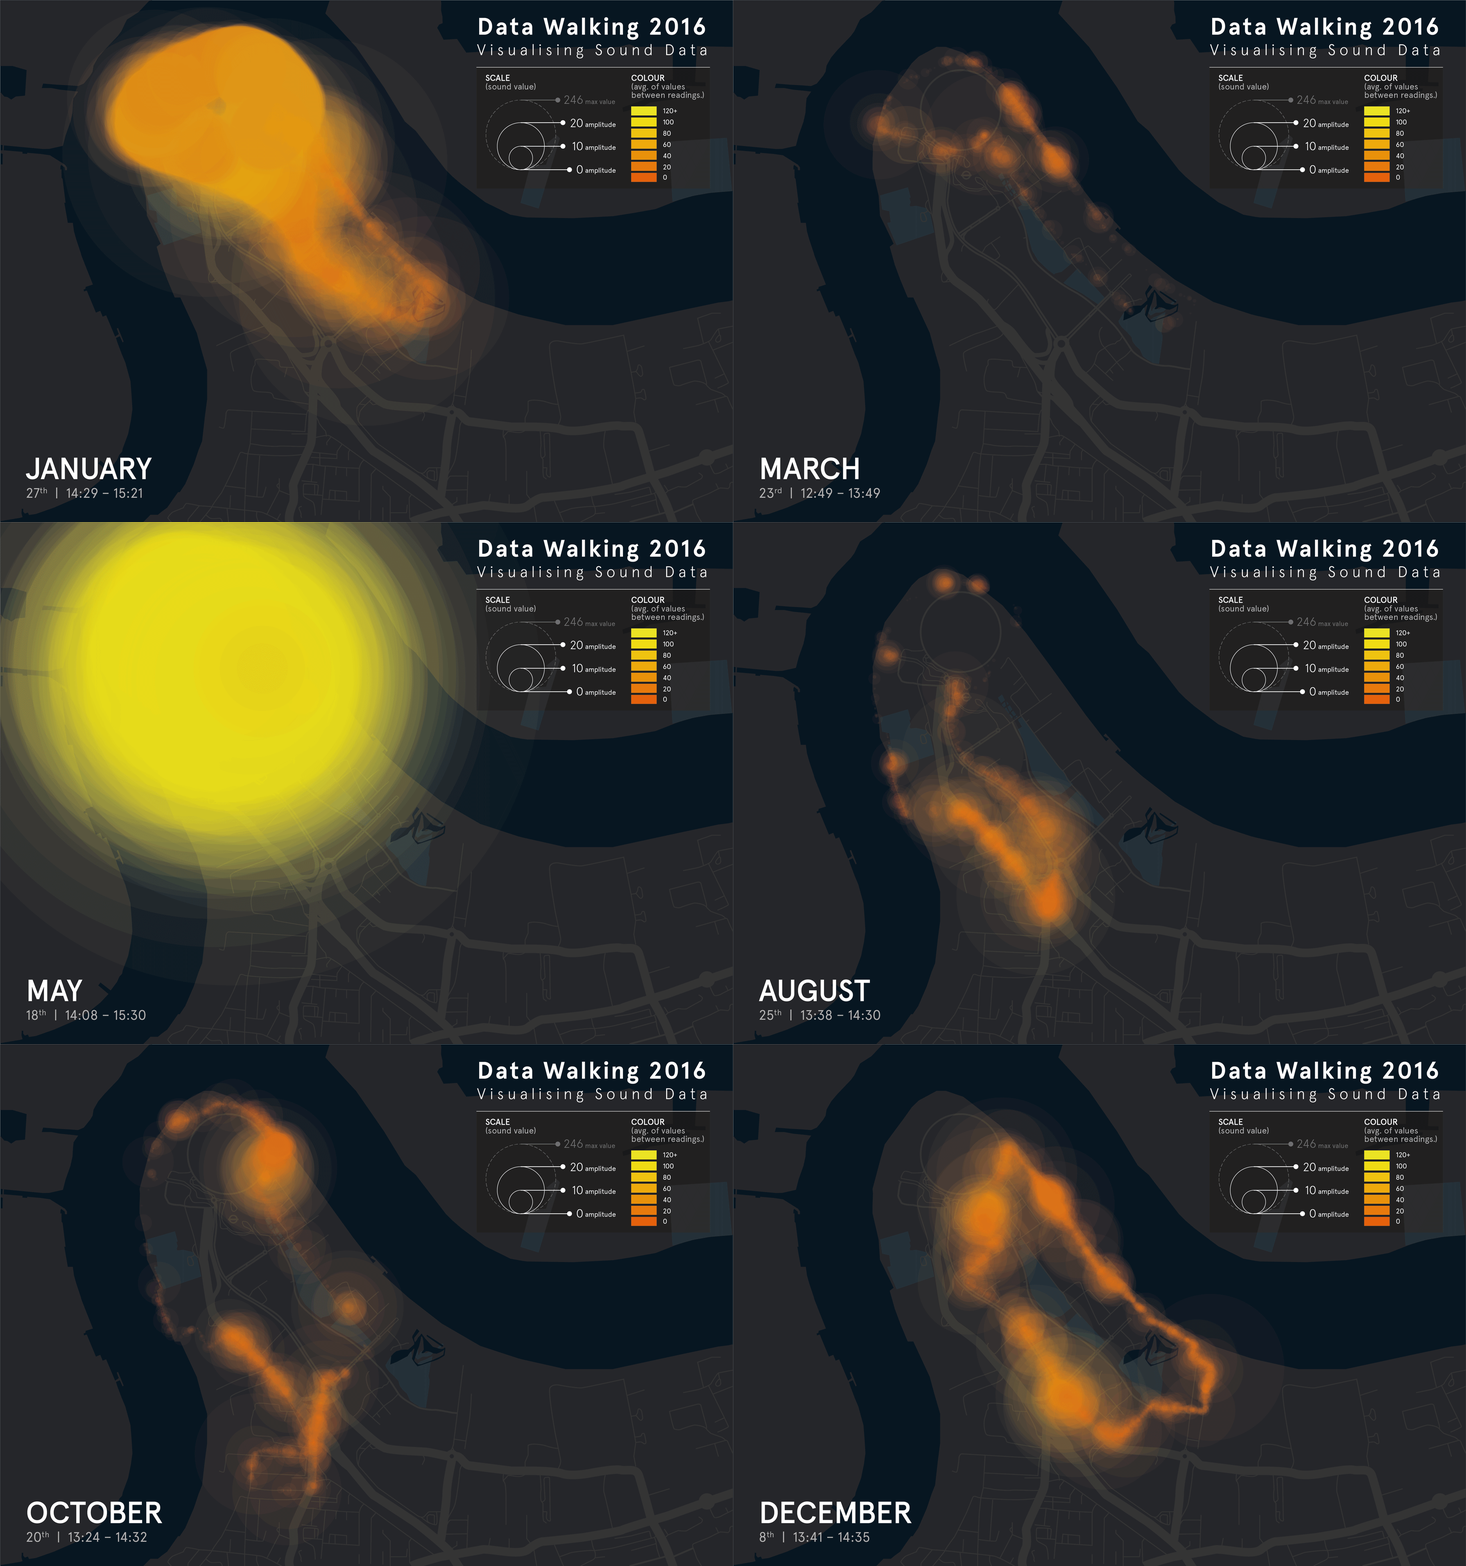
When looking at the raw data I was intrigued by the 'sound average' values, and was wondering between the combination of parks and motorways found in North Greenwich how that sound changed across the data walks. To see the pattern in the data I plotted a series of points scaled by the sound amplitude. Through this I discovered that the sound is louder nearer main roads, which is to be expected, but also quite loud at some key locations by the river and near The O2. It was also interesting to see the sound patterns change over the year as the location of the walk changed.
When looking at the raw data I was intrigued by the 'sound average' values, and was wondering between the combination of parks and motorways found in North Greenwich how that sound changed across the data walks. To see the pattern in the data I plotted a series of points scaled by the sound amplitude. Through this I discovered that the sound is louder nearer main roads, which is to be expected, but also quite loud at some key locations by the river and near The O2. It was also interesting to see the sound patterns change over the year as the location of the walk changed.


 The Data Walking printed publication. Photo courtesy of David Hunter Design
 PDF screencapture of the spread in the book with my contribution to the project