Airport Baggage Targets Visualization
Designed at QuantumBlack
Year: 2015
Designer: Calum Hale
Creative direction: Yves Boussemart
Design © QuantumBlack Visual Analytics Ltd.
All data anonymised
Quantumblack investigated optimising the allocation of arriving baggage from the gate to terminal for a major airport hub in Asia. I designed a way of seeing if the time for the bag to arrive at baggage reclaim was over or under target.
The size of the bubble is the number of flights per year that gate receives, the size of the circle segment is the potential target improvement, the inner ring is the first bag target, and the outer ring is the lsat bag target, with the circumference of the circle being the range from 0% to 100%.
The size of the bubble is the number of flights per year that gate receives, the size of the circle segment is the potential target improvement, the inner ring is the first bag target, and the outer ring is the lsat bag target, with the circumference of the circle being the range from 0% to 100%.
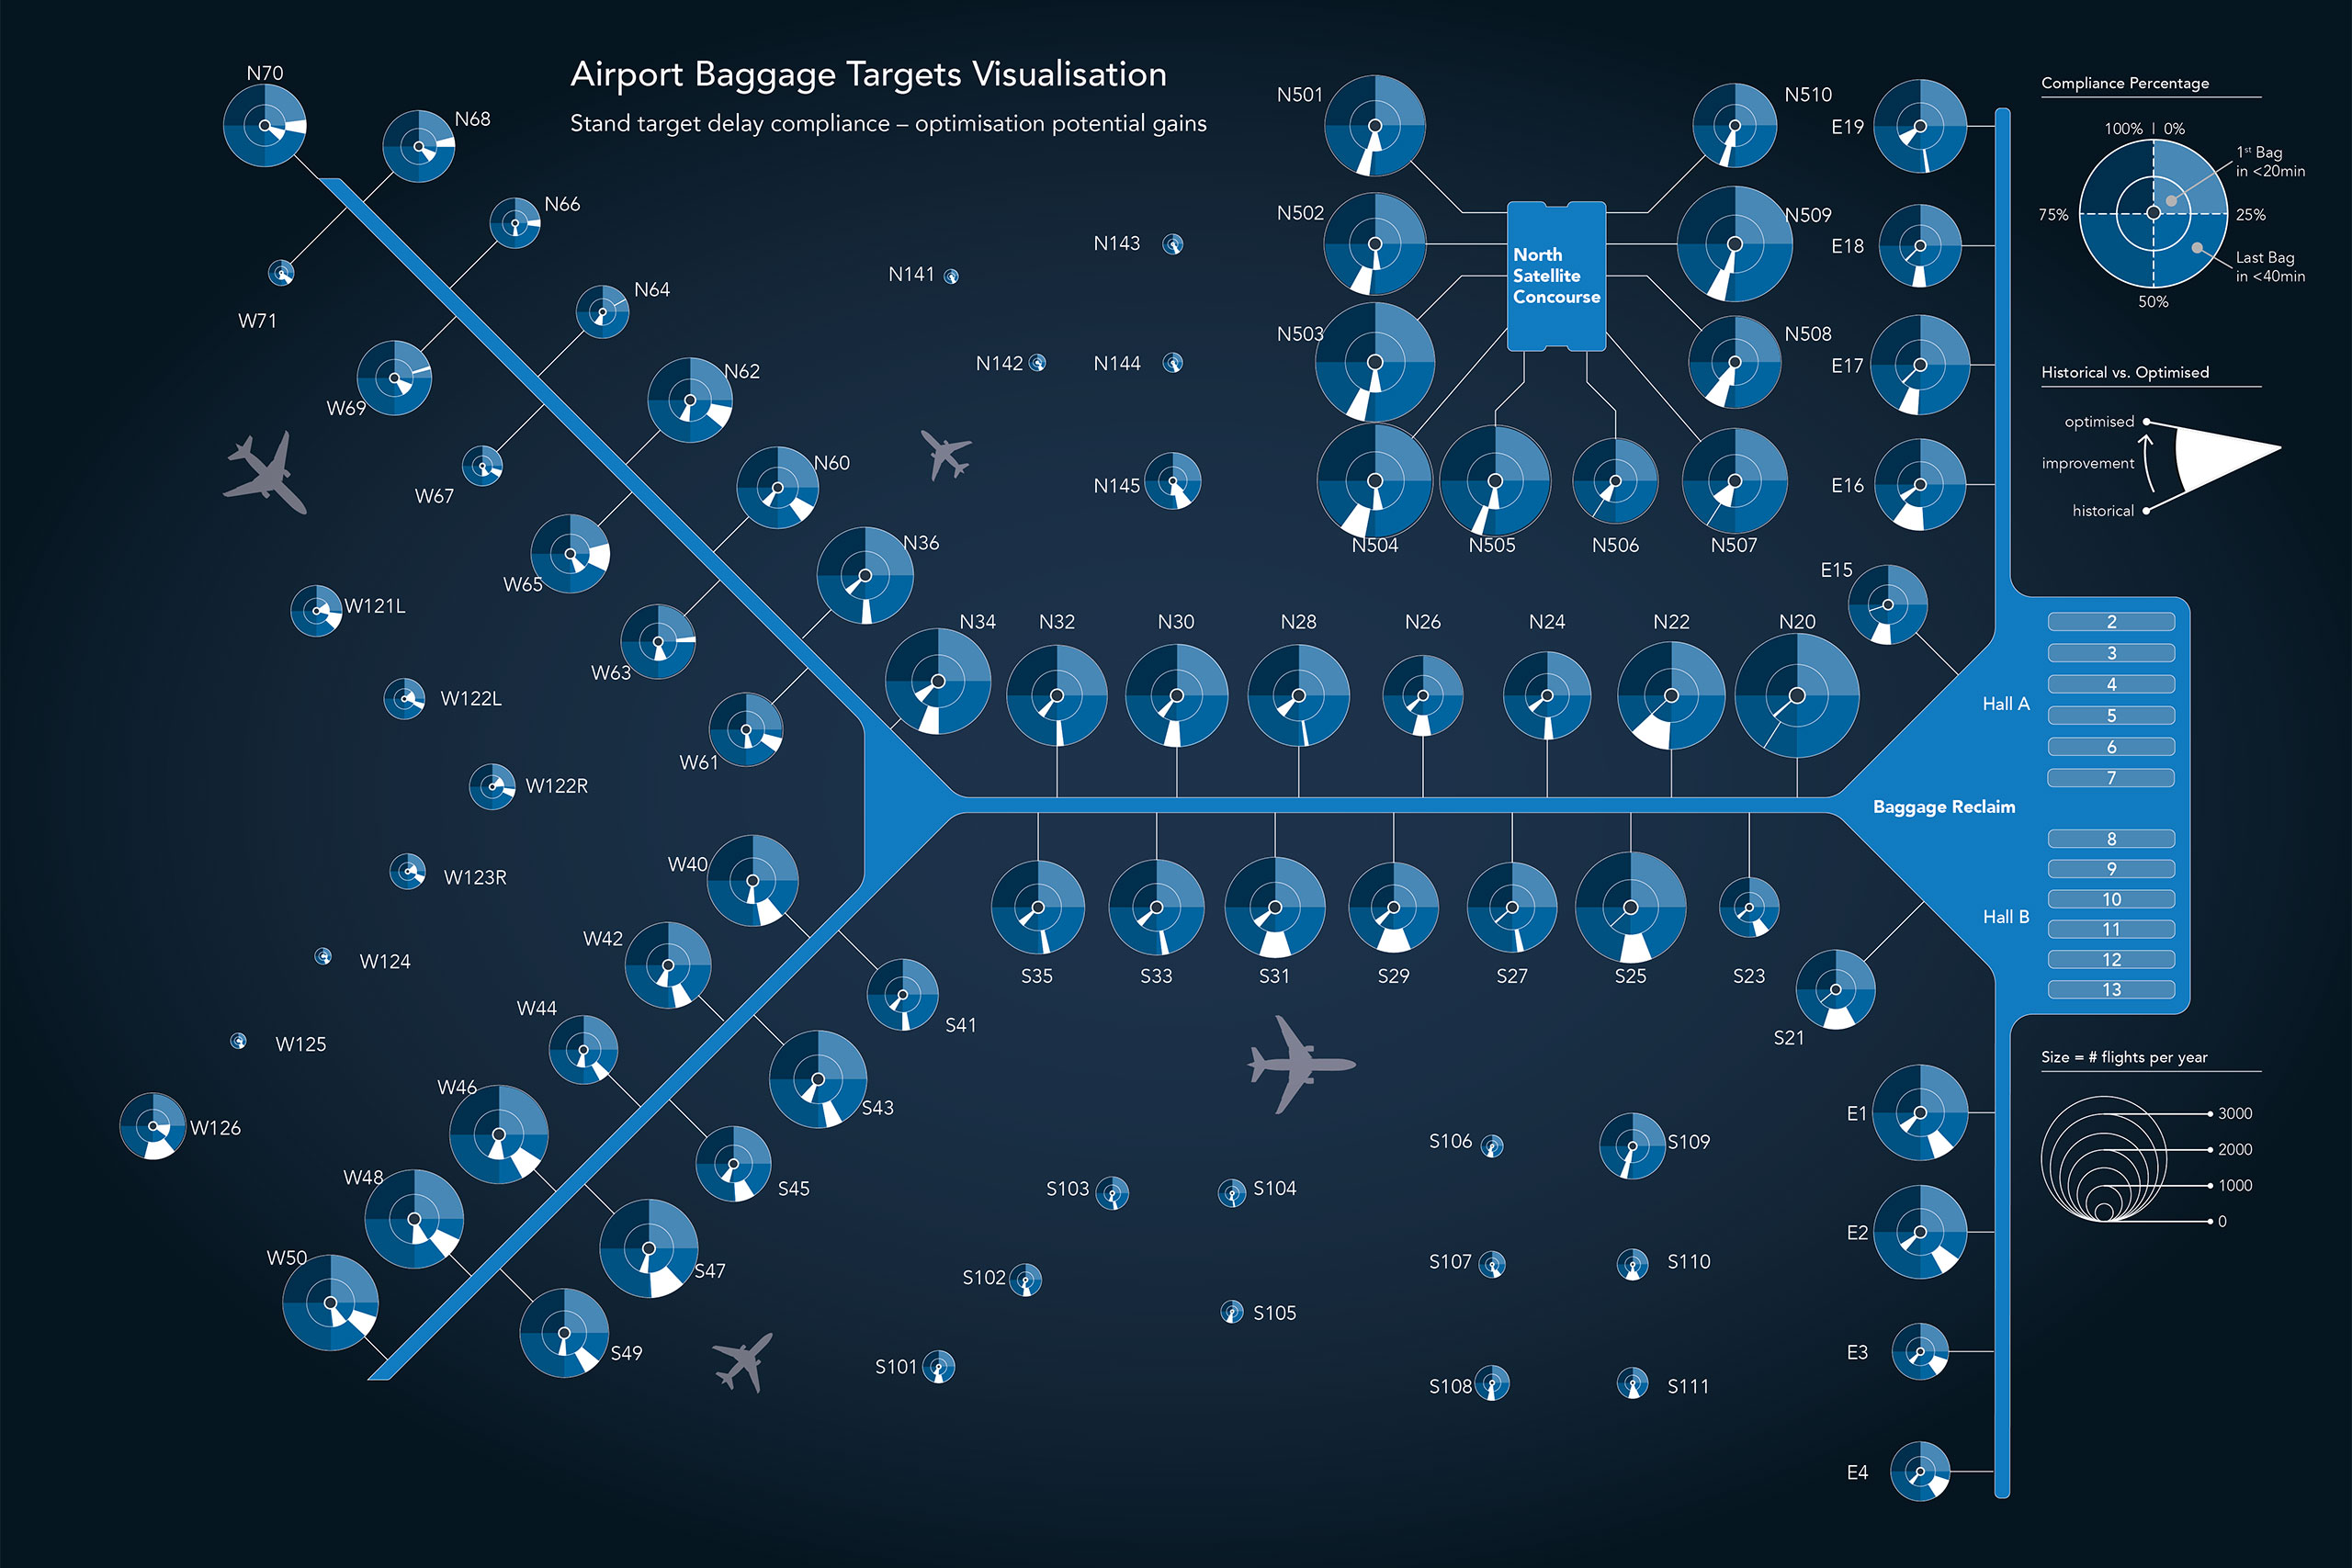 Final airport baggage targets visualisation
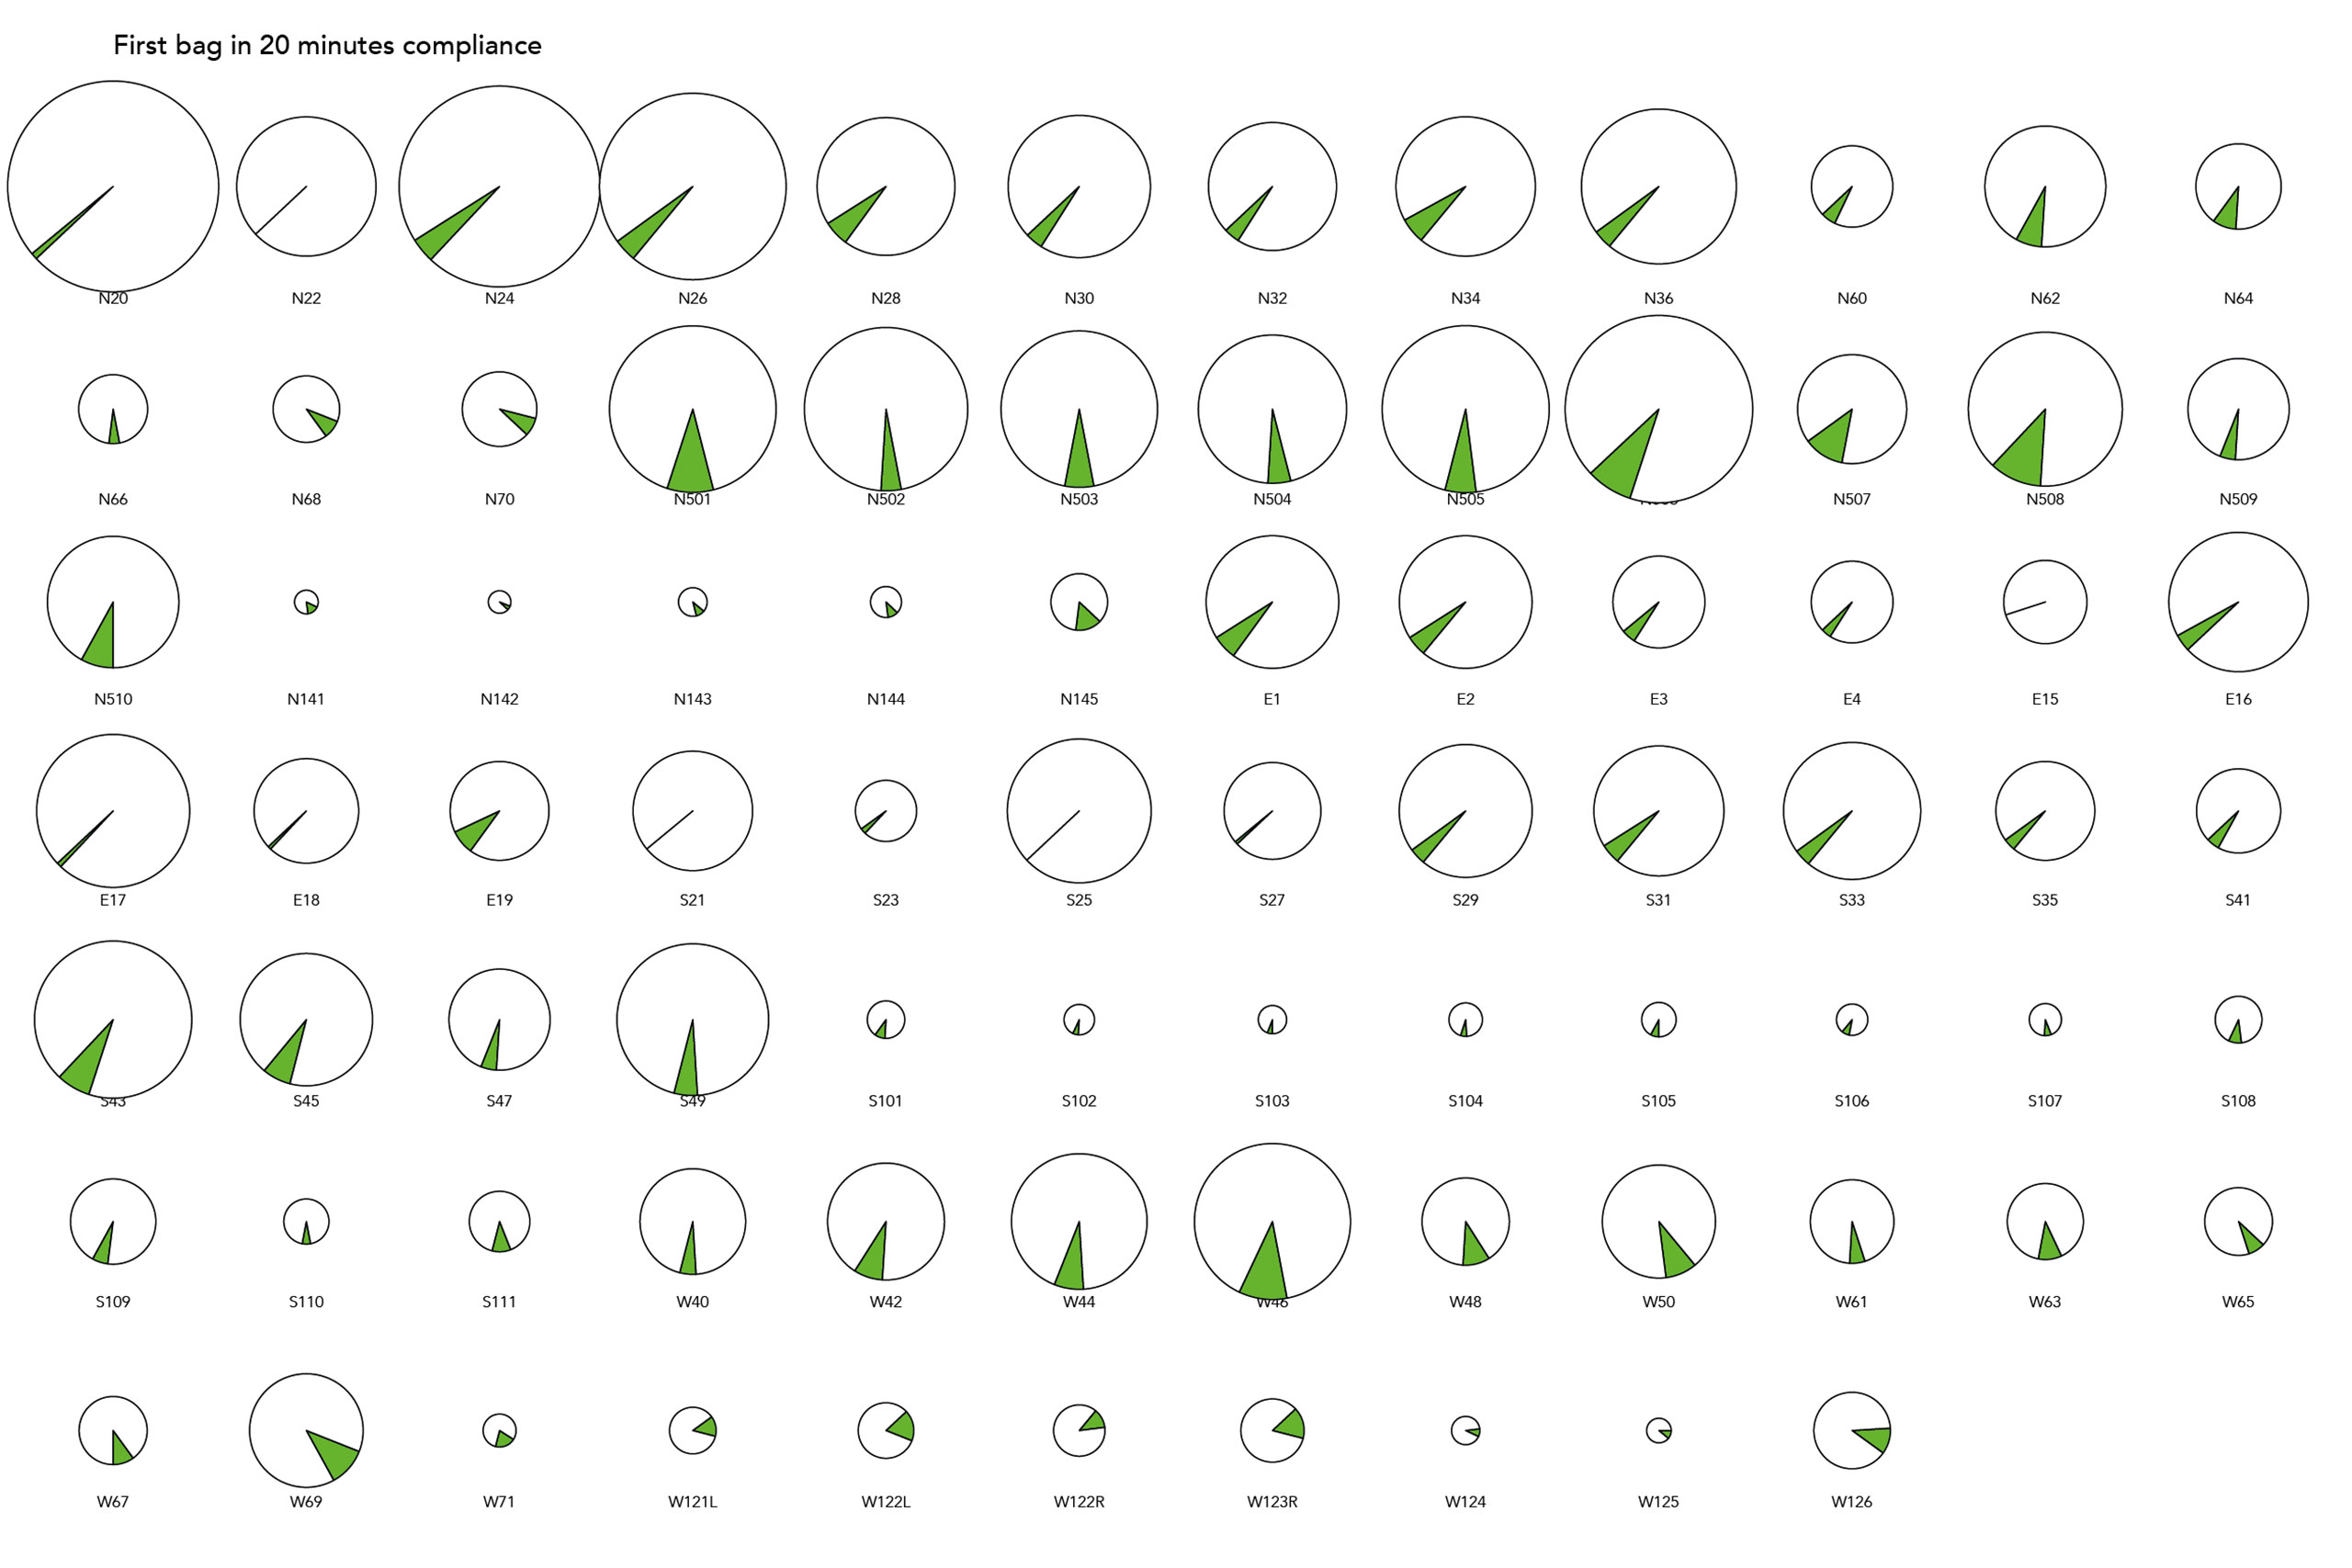
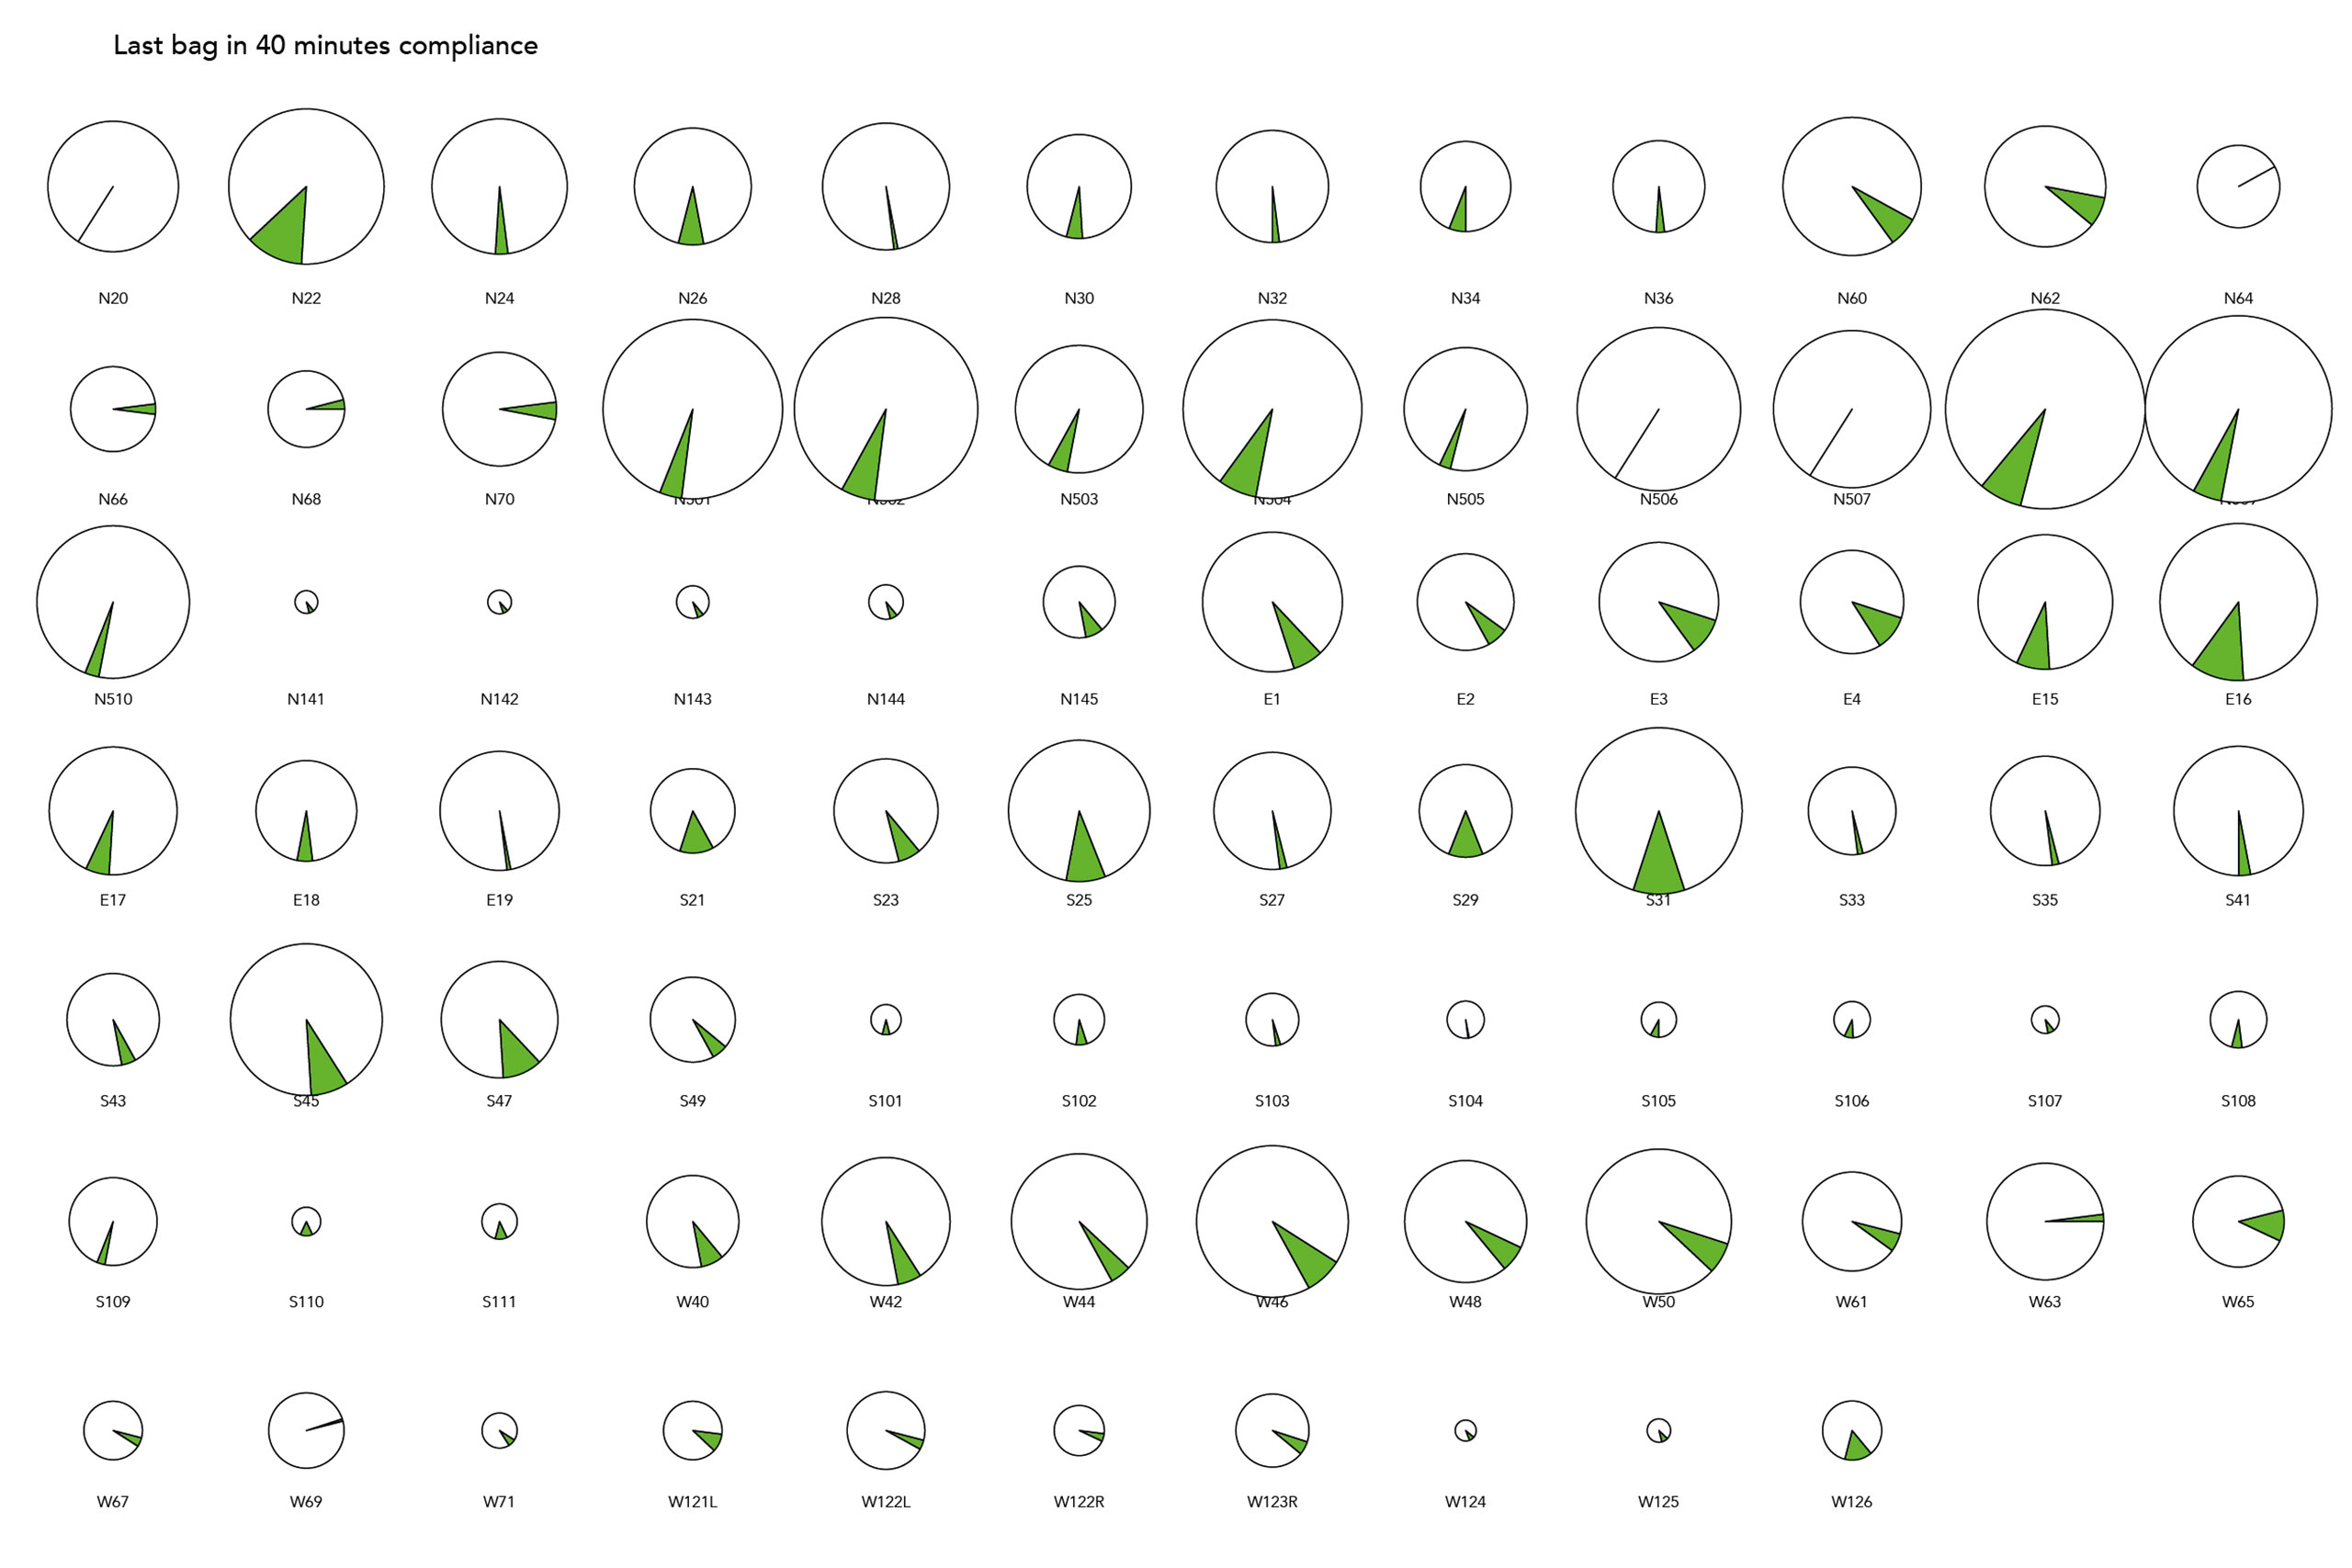 Pie charts created by data scientists to help plot the values to be geographically placed
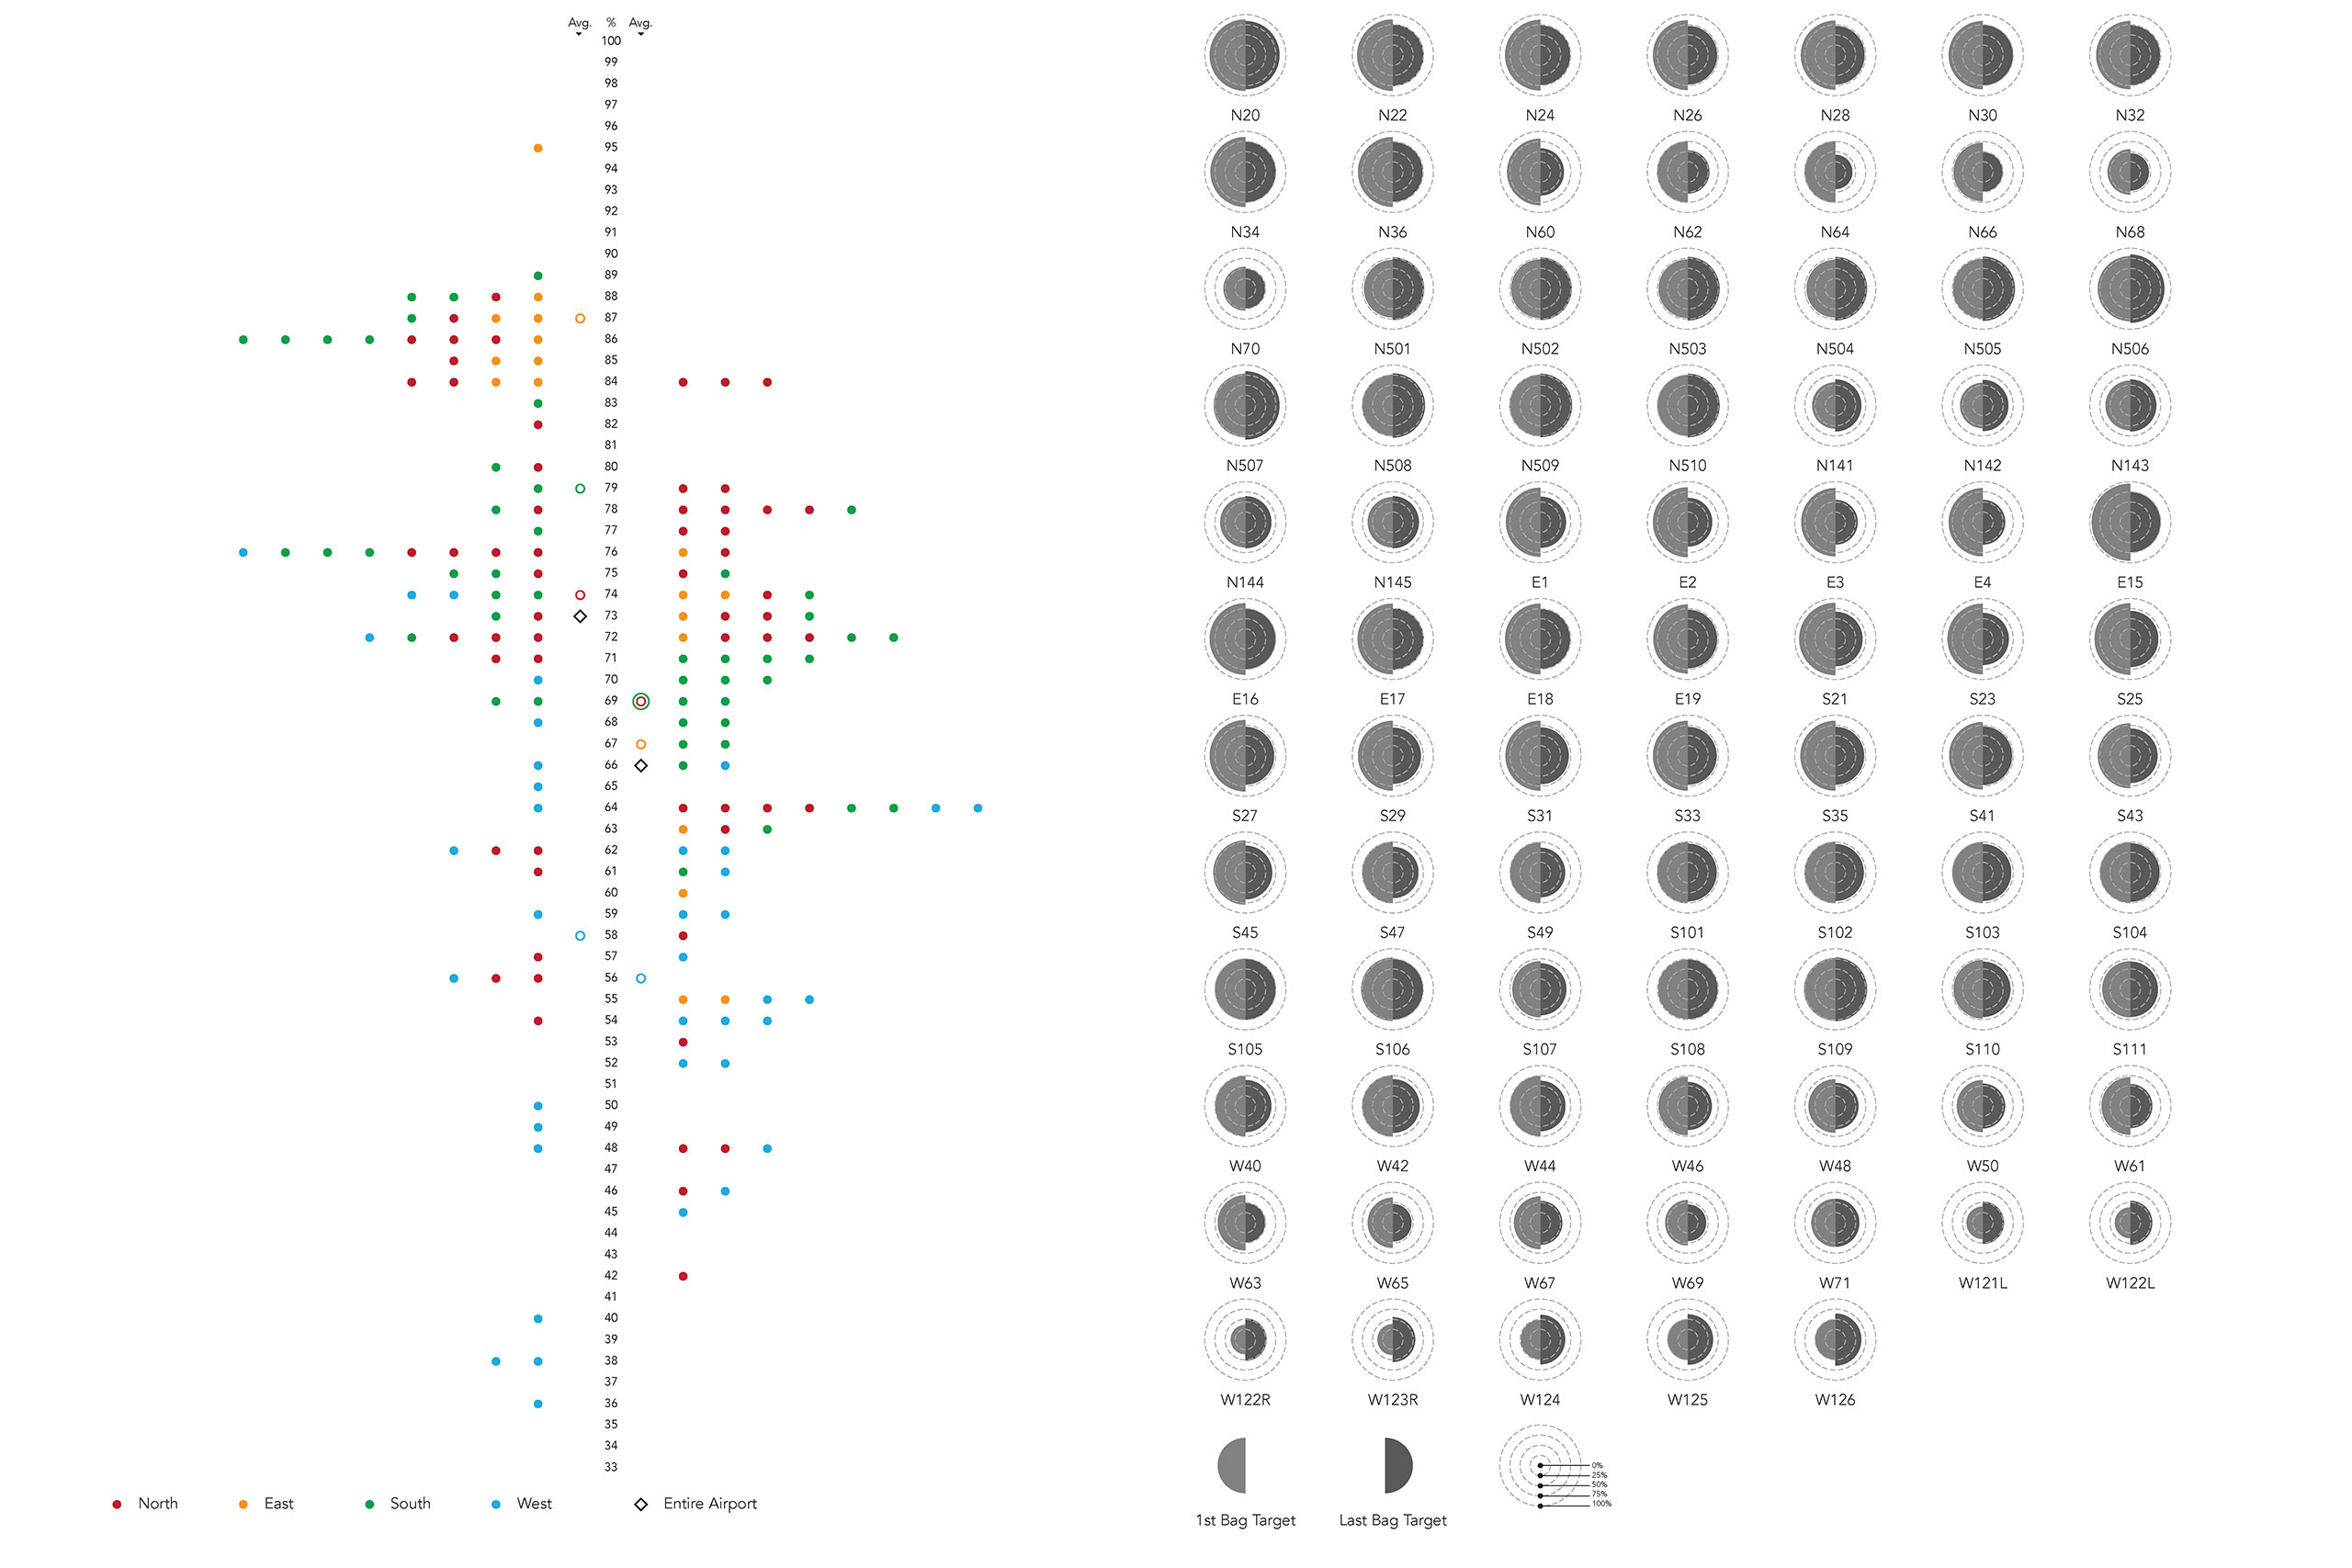 Concept designs for displaying the baggage delay information
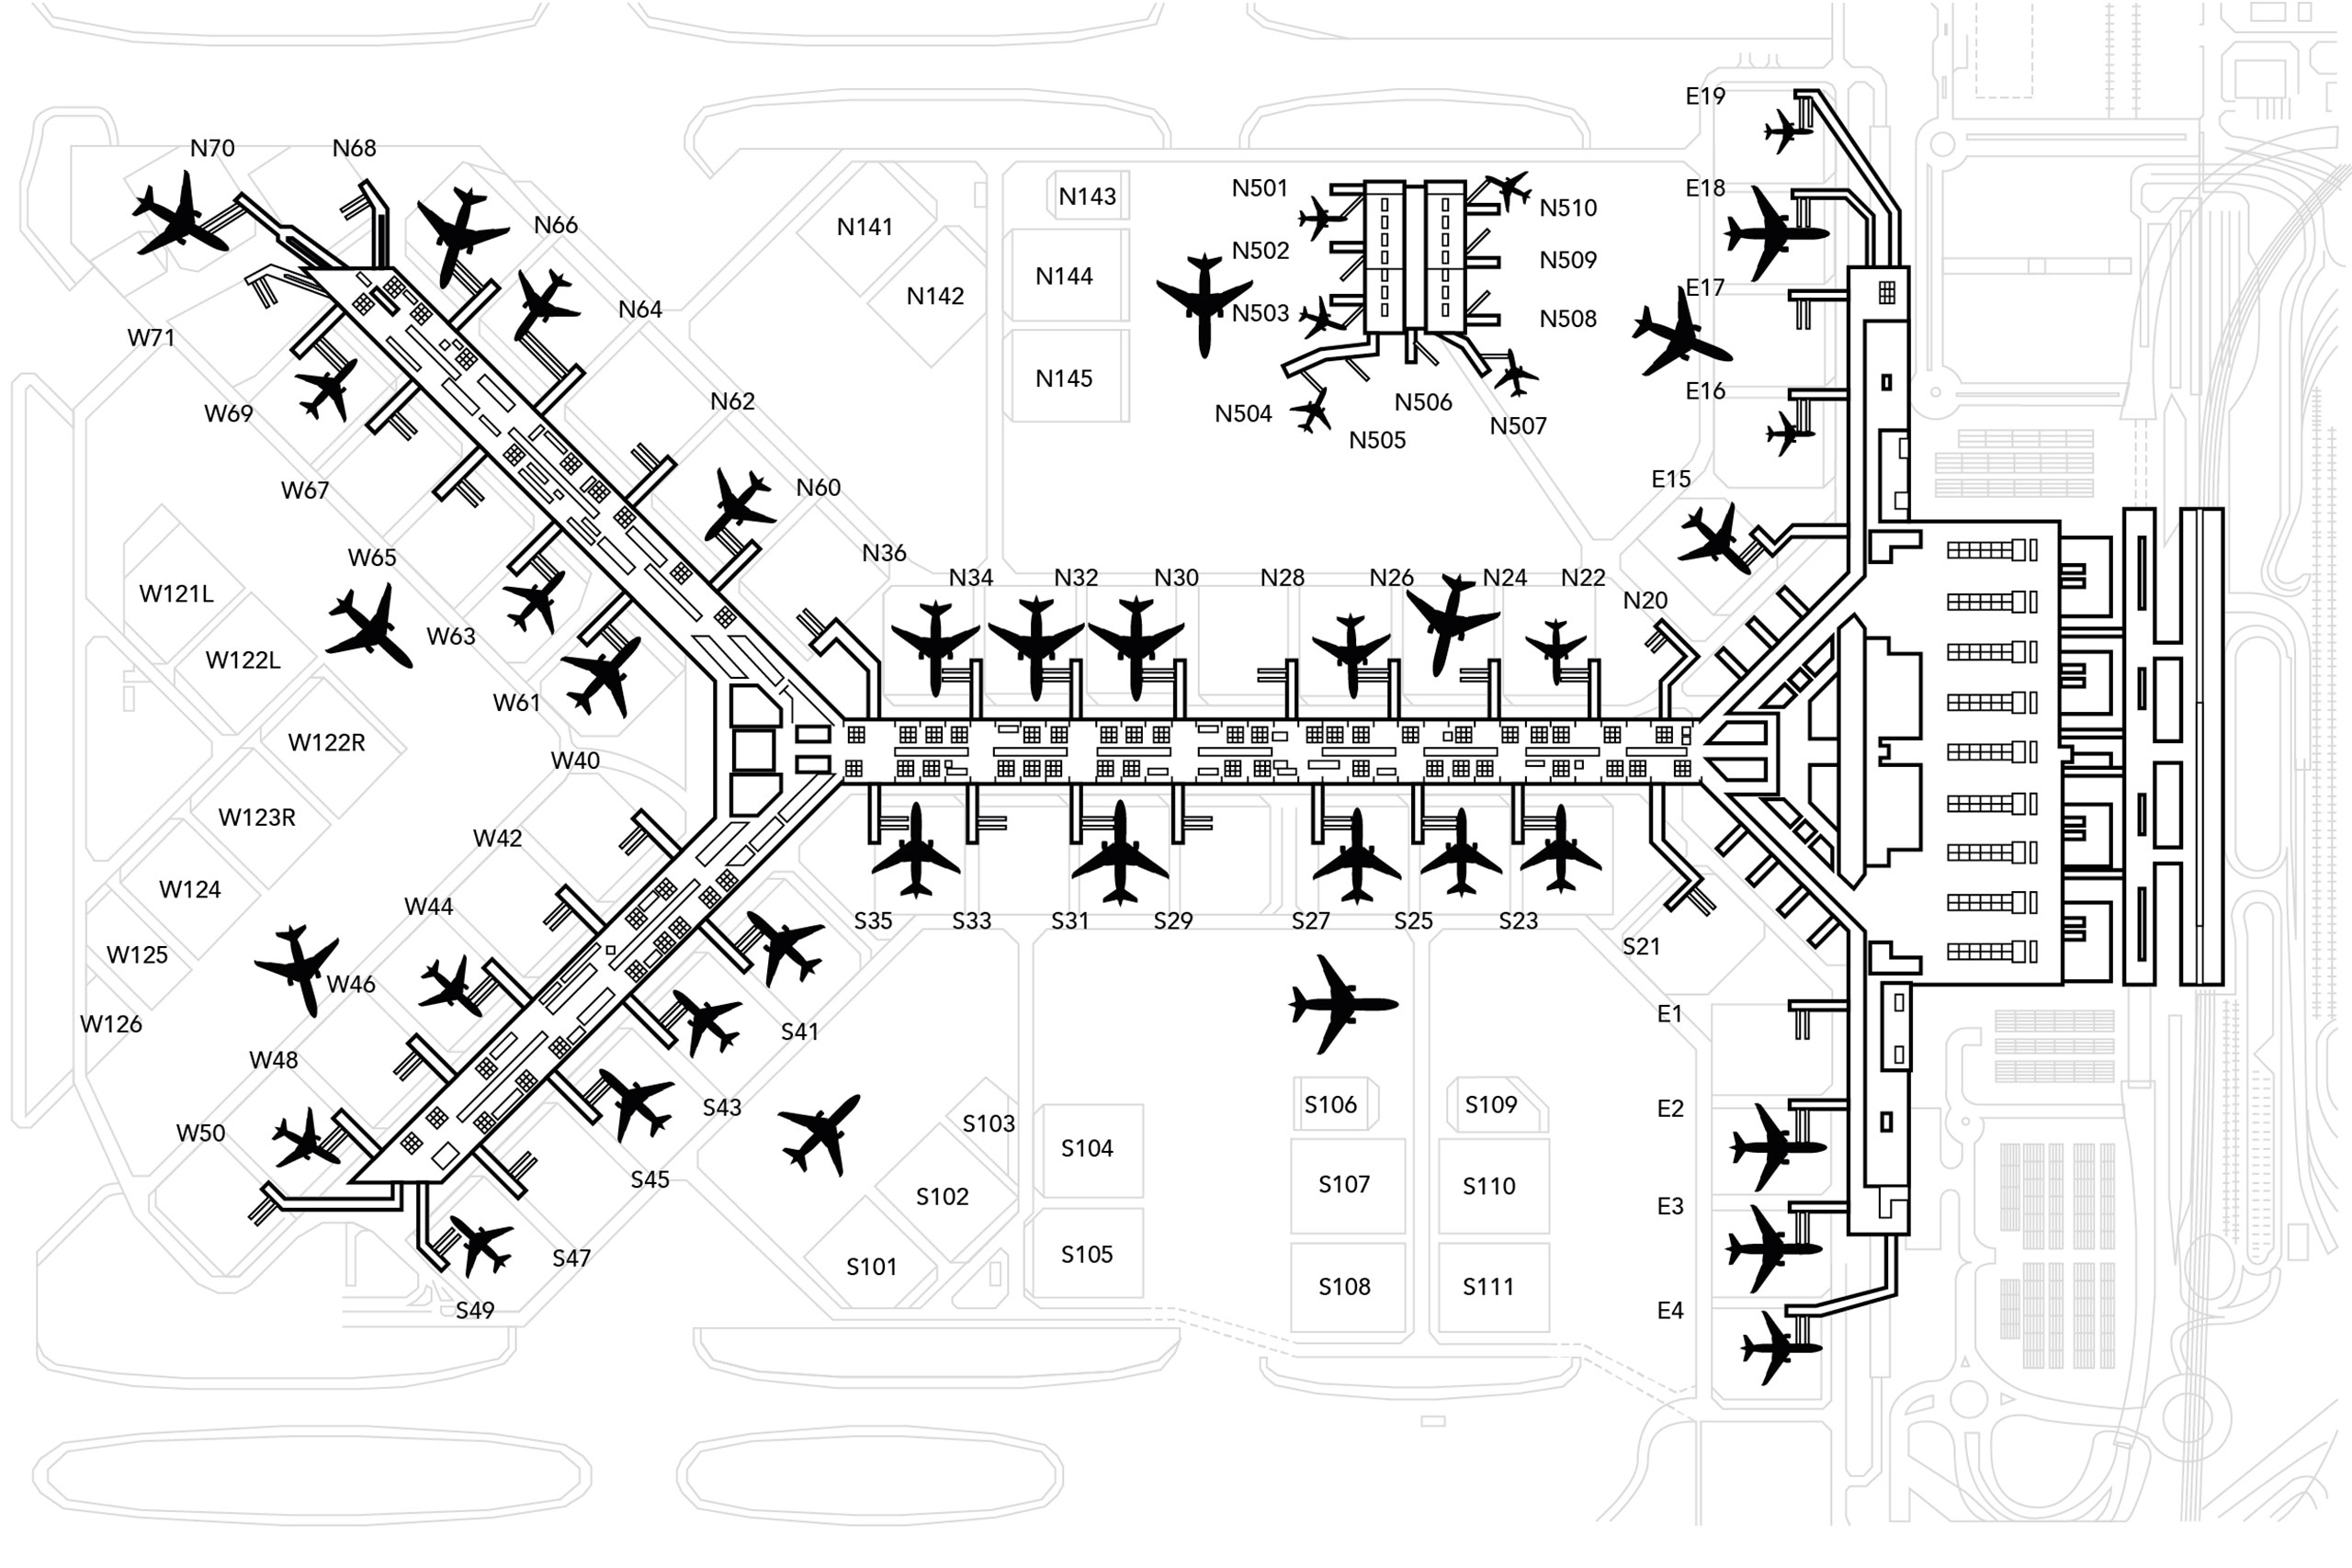 Airport schematic created for plotting data onto